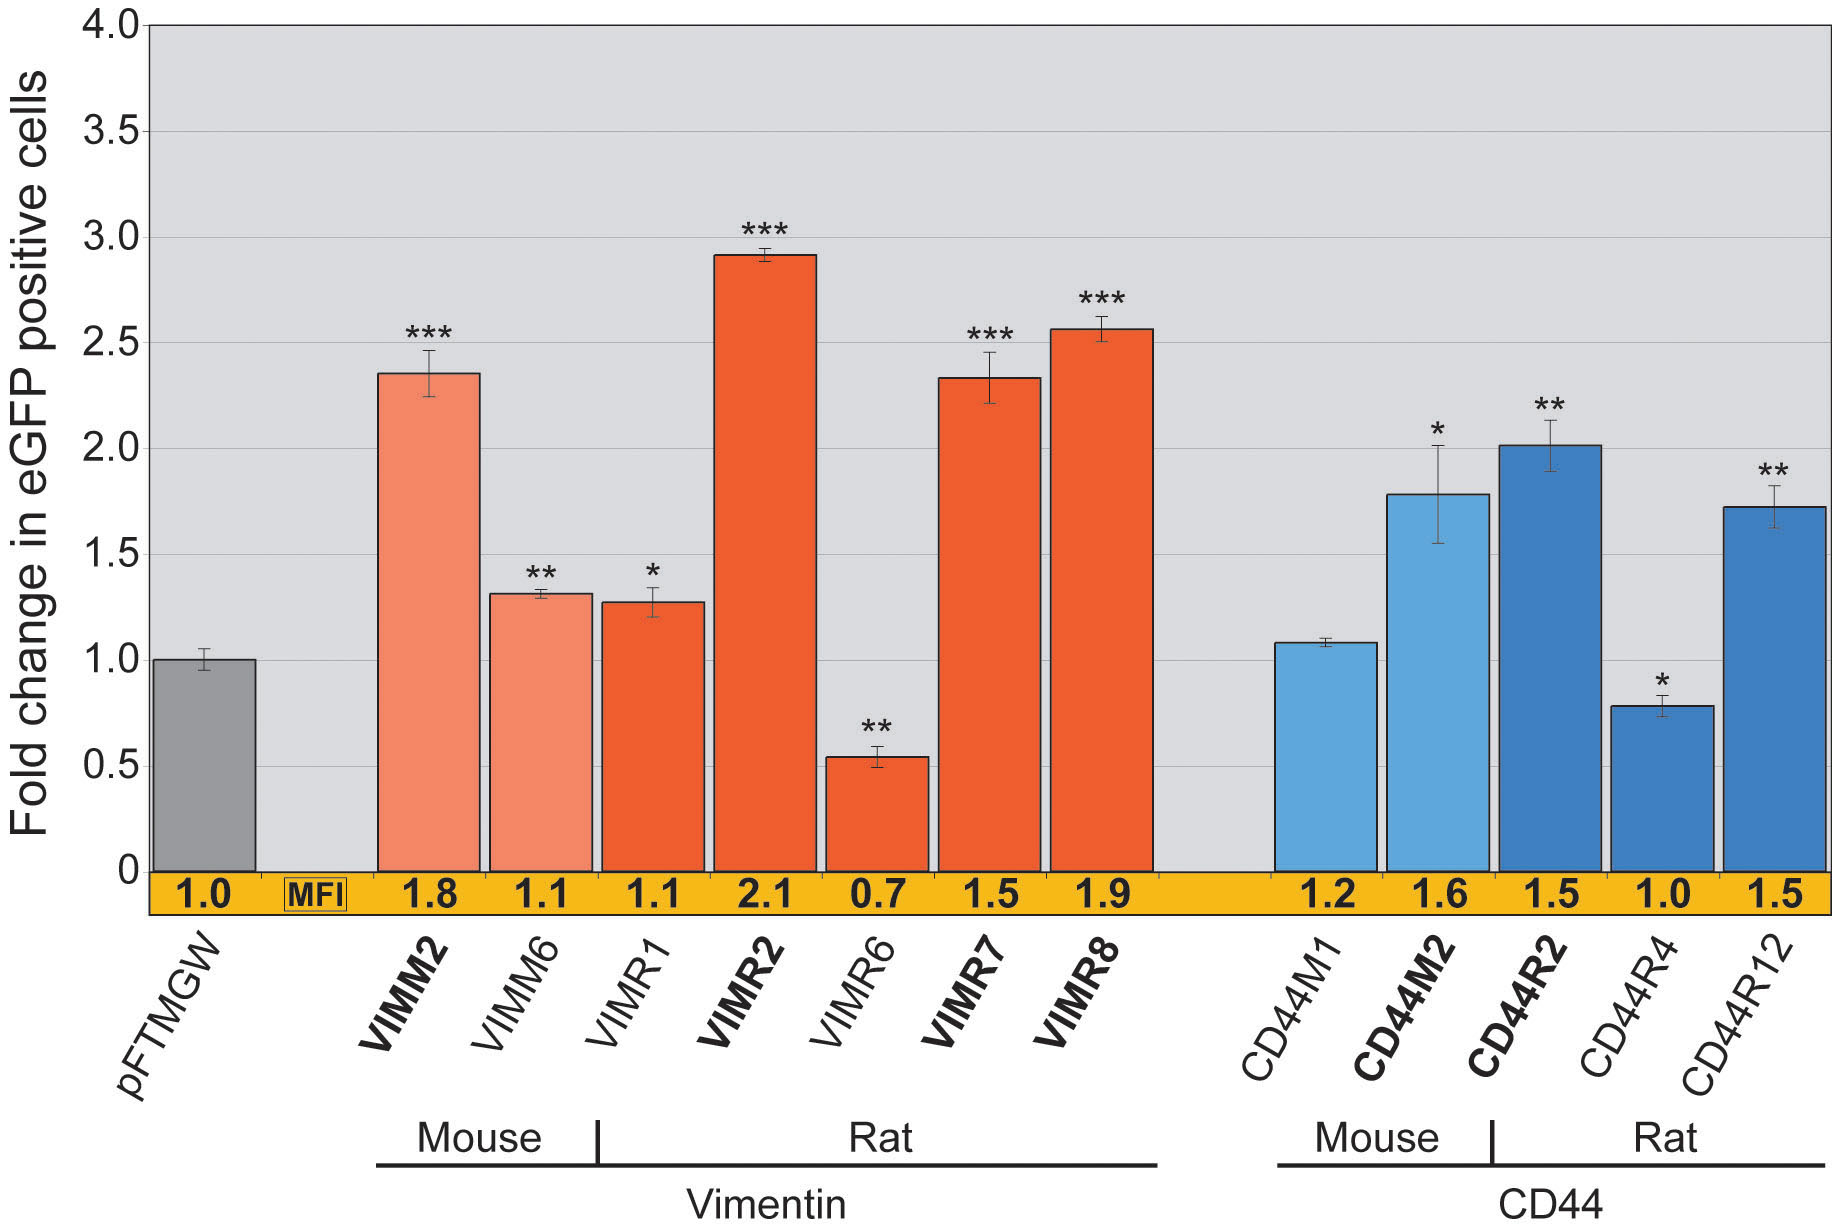
Figure 5. Transfection of mouse and rat
evolutionarily conserved regions from the VIM and
CD44 genes in
wMC (rat) Müller cells. Constructs containing either 5′ (
VIMM2,
VIMR2,
CD44M2,
CD44R2) or 3′ (VIMR7 and VIMR8) UTRs exhibited
high eGFP expression levels (shown in bold). VIM constructs are shown
in red, and CD44 constructs are shown in blue; lighter colors are mouse
constructs and darker colors are rat constructs. Bars indicate fold
change in number of eGFP positive cells, normalized to the
“first-generation” promoter-less parent vector (pFTMGW). The mean
fluorescence intensity (MFI) for each construct was also normalized to
the parent vector (pFTMGW) [
22]
and is shown immediately below each bar (shown in orange). Refer to
Appendix 2
for genomic coordinates of each construct. The single asterisk equals
p<0.01, the double asterisk equals p<0.001, and the triple
asterisk equals p<0.0001, using a two-tailed Student's
t-test
assuming equal variances. Error bars represent 1 standard deviation.
 Figure 5 of Geller, Mol Vis 2008; 14:691-705.