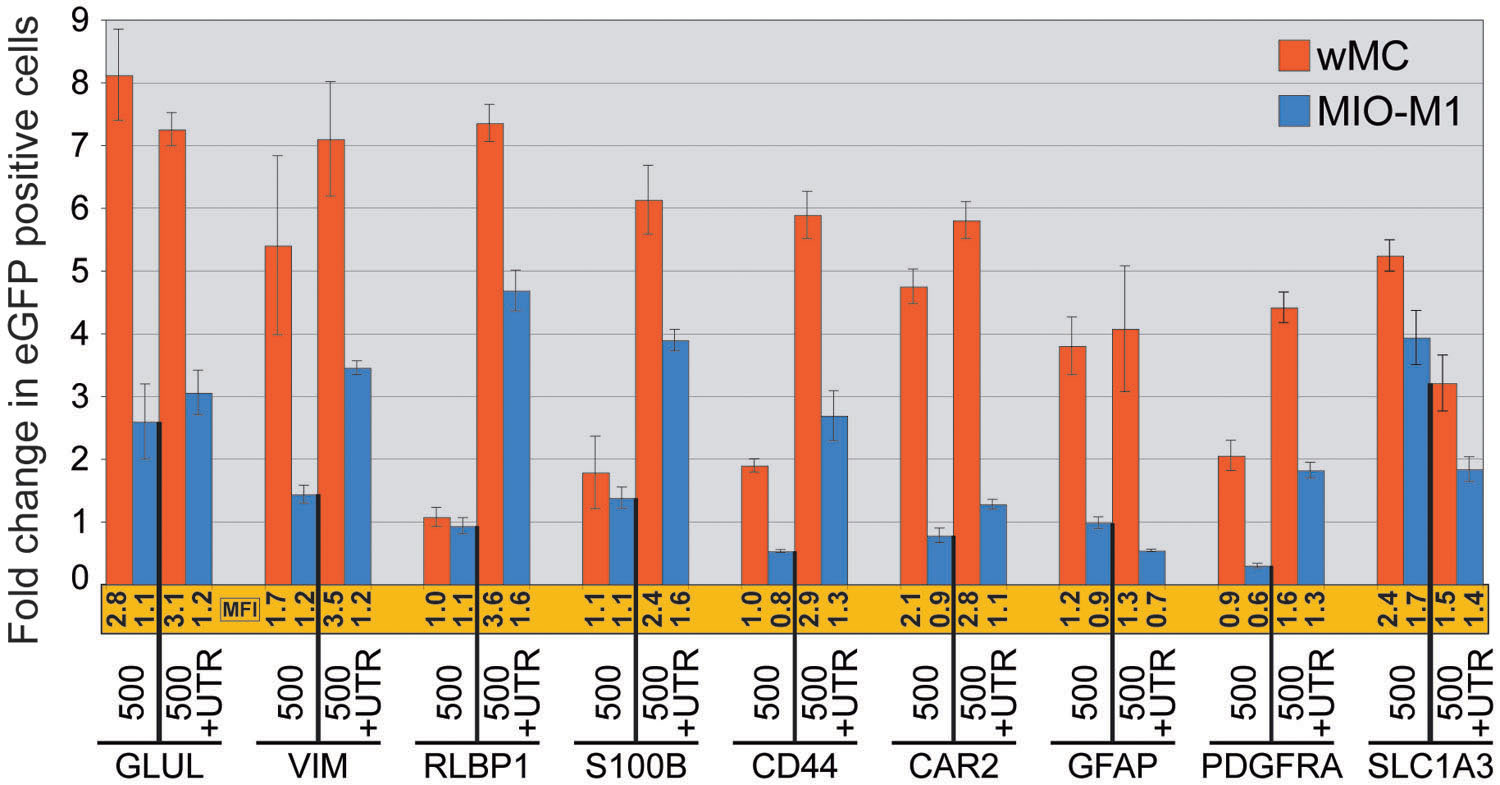
Figure 4. Comparison of promoter regulated
gene expression in rat (wMC) and human (MIO-M1) Müller cells. Müller
cells were transfected with 500 bp or 500+UTR genomic DNA constructs
(mouse) from each of the nine genes analyzed. Expression was more
robust in rat Müller cells (red bars) when compared with human MIO-M1
Müller cells (blue bars), although the trends in promoter-driven
transgene expression are similar between species and within genes. Bars
indicate fold change in number of eGFP positive cells, normalized to
the promoter-less parent vector (pFTM3GW). The mean fluorescence
intensity (MFI) for each construct was also normalized to the parent
vector (pFTM3GW) and is shown immediately below each bar (shown in
orange). Refer to
Appendix 1
for genomic coordinates of each construct. Error bars represent 1
standard deviation.
 Figure 4 of Geller, Mol Vis 2008; 14:691-705.