![]() Figure 3 of
Ishino, Mol Vis 2008;
14:61-70.
Figure 3 of
Ishino, Mol Vis 2008;
14:61-70.
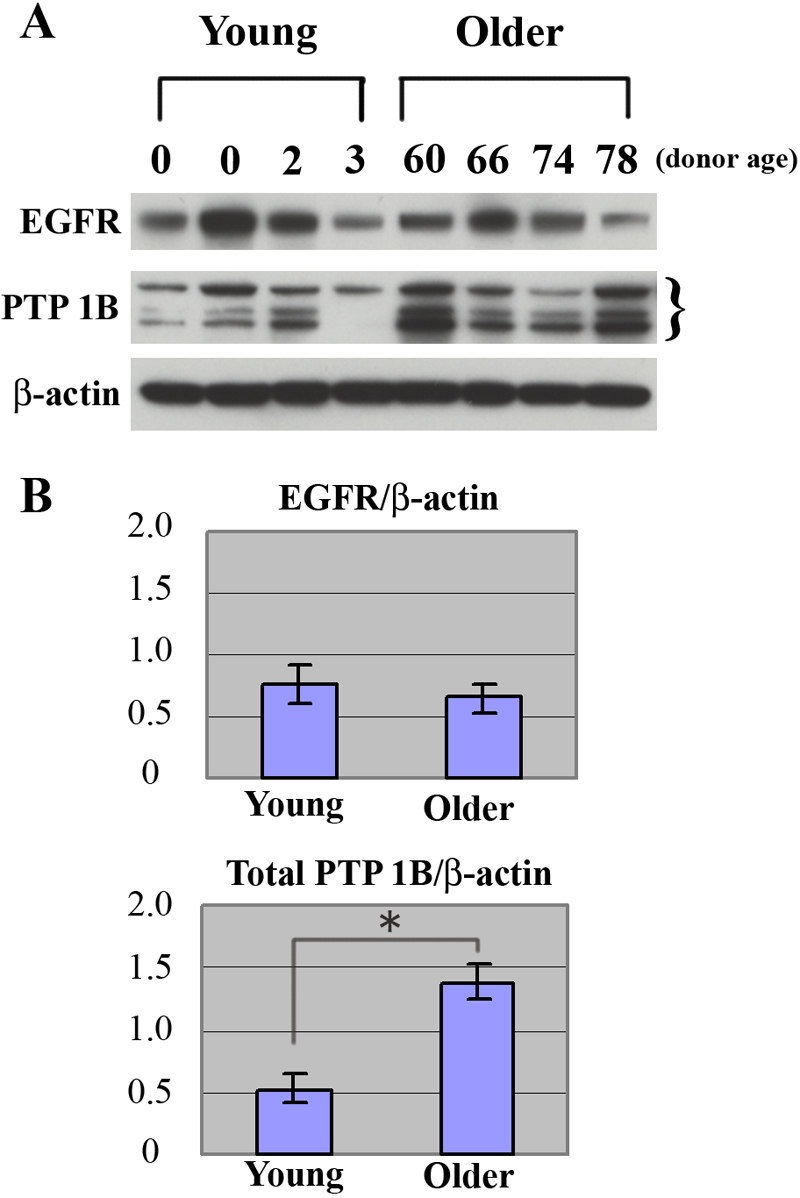
Figure 3. Comparison of EGFR and PTP1B protein expression in HCEC cultured from 4 young and 4 older donors
A: Western blots demonstrate the relative expression of EGFR and PTP1B in each of the 8 donor samples. EGFR was expressed in all 8 samples, although the band density varied somewhat among the samples. Three PTP1B bands were observed in most samples. These bands are indicated within brackets. Blots for the positive controls for EGFR (EGF-treated A431cells) and PTP1B (SW480 cells) are not shown, but bands were obtained at the same relative molecular weights as in the HCEC samples. β-Actin was used as a loading control for both EGFR and PTP1B. B: Comparison of the average band density for EGFR and PTP1B in samples from young and older donors. Bars represent SEM. Asterisk indicates statistical significance (p=0.024).