Figure 1 of
Ponsioen, Mol Vis 2008; 14:652-660.
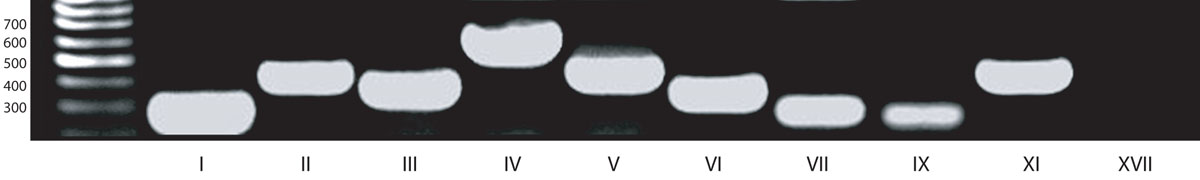
Figure 1.
RT–PCR on Müller cell extracts. From left to right, bands indicating the positions of types I, II, III, IV, V, VI, VII, IX, XI, and XVII collagen are depicted. At the left margin, a 100 bp DNA ladder has been added.
 Figure 1 of
Ponsioen, Mol Vis 2008; 14:652-660.
Figure 1 of
Ponsioen, Mol Vis 2008; 14:652-660.