Figure 4. Flow cytometric analysis of phaseolus vulgaris agglutinin binding on the surface of human uveal (92–1, Mel202) and cutaneous
melanoma (FM55P, IGR-39) cells. A: Histogram of fluorescence intensity with or without fluorescein isothiocyanate (FITC)-conjugated phaseolus vulgaris agglutinin.
B: Quantification of data from flow cytometric analyses. Fluorescence intensity relative to negative control, representing means
from three pooled experiments. Asterisk (*) indicates p<0.05.
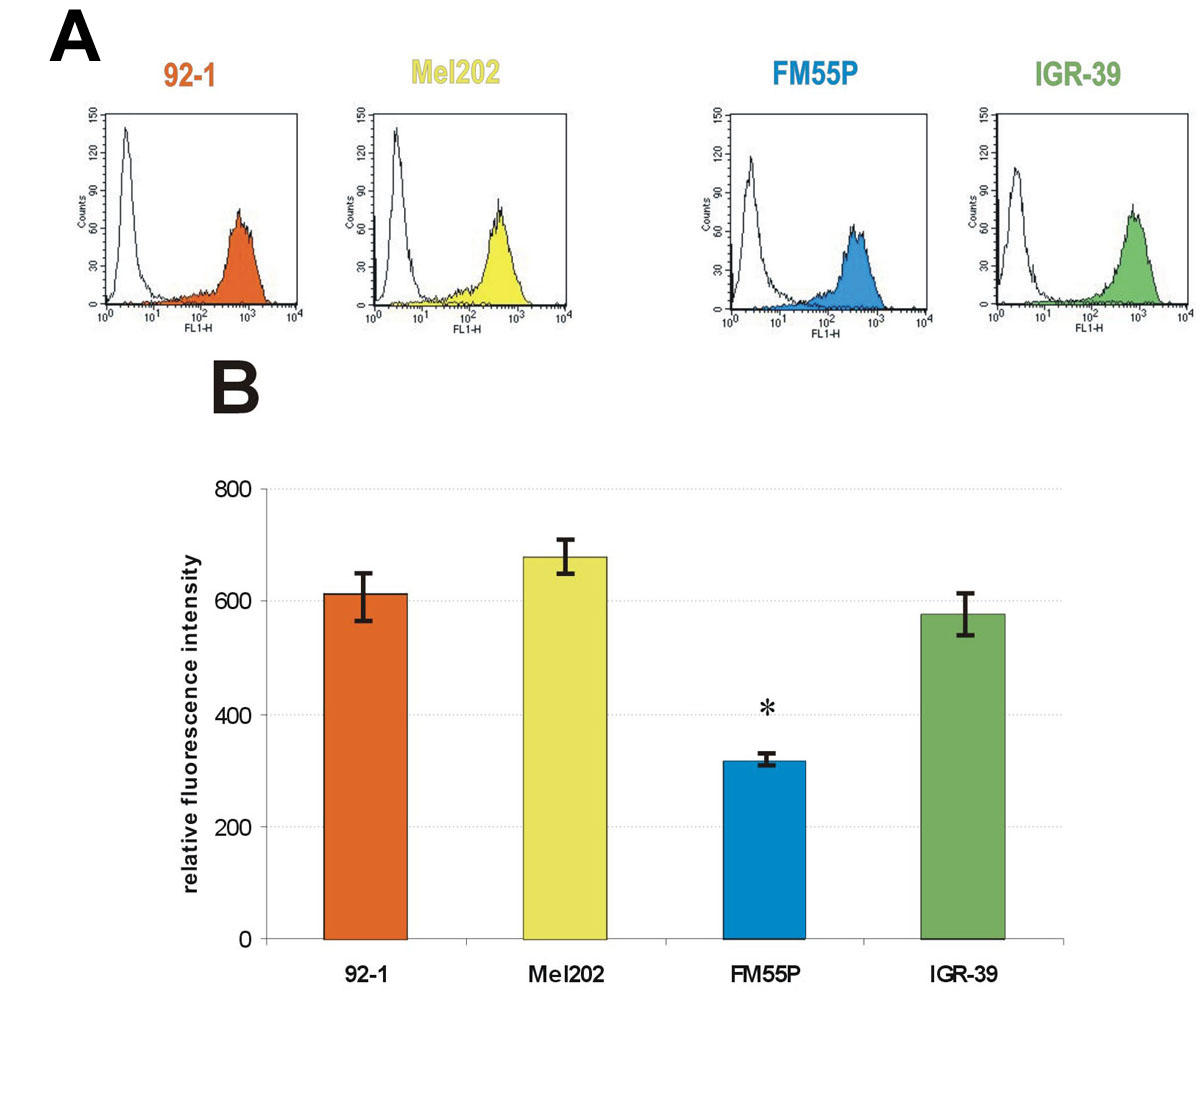
 Figure 4 of
Przybyło, Mol Vis 2008; 14:625-636.
Figure 4 of
Przybyło, Mol Vis 2008; 14:625-636.