Figure 3. Expression of integrins on human uveal (92–1, Mel202) and cutaneous melanoma (FM55P, IGR-39) cells. Melanoma cells were examined
by flow cytometry for the expression of α3β1, α4β1, α5β1, and αvβ3 integrins, and data were compared to cells incubated with normal mouse IgG. Fluorescein isothiocyanate (FITC)-conjugated
rabbit anti-mouse IgG (Fab’)2 fragments were used for detection. Fluorescence signals of 10,000 cells were counted for each integrin subunit tested. Histograms
of cells versus log fluorescence were generated. A: Panels show FACS profile for integrin-positive cell lines. Colored areas indicate the fluorescence profile of cells after
indirect fluorescence staining with anti-integrin monoclonal antibodies. Open histograms represent background fluorescence.
Relative fluorescence is shown as a logarithmic scale of 4 log cycles on the x-axis, and cell number as a linear scale on
the y-axis. Data from one of three similar experiments are presented. The negative control for each line is different in some
experiments because the experiments were not run on the same occasion. B: Diagram shows percentage of melanoma cells expressing α3β1, α4β1, α5β1, and αvβ3 integrins. C: Diagram shows quantitation of data from flow cytometric analyses. Values are means ± standard deviation of three separate
experiments. Asterisk (*) indicates p<0.05.
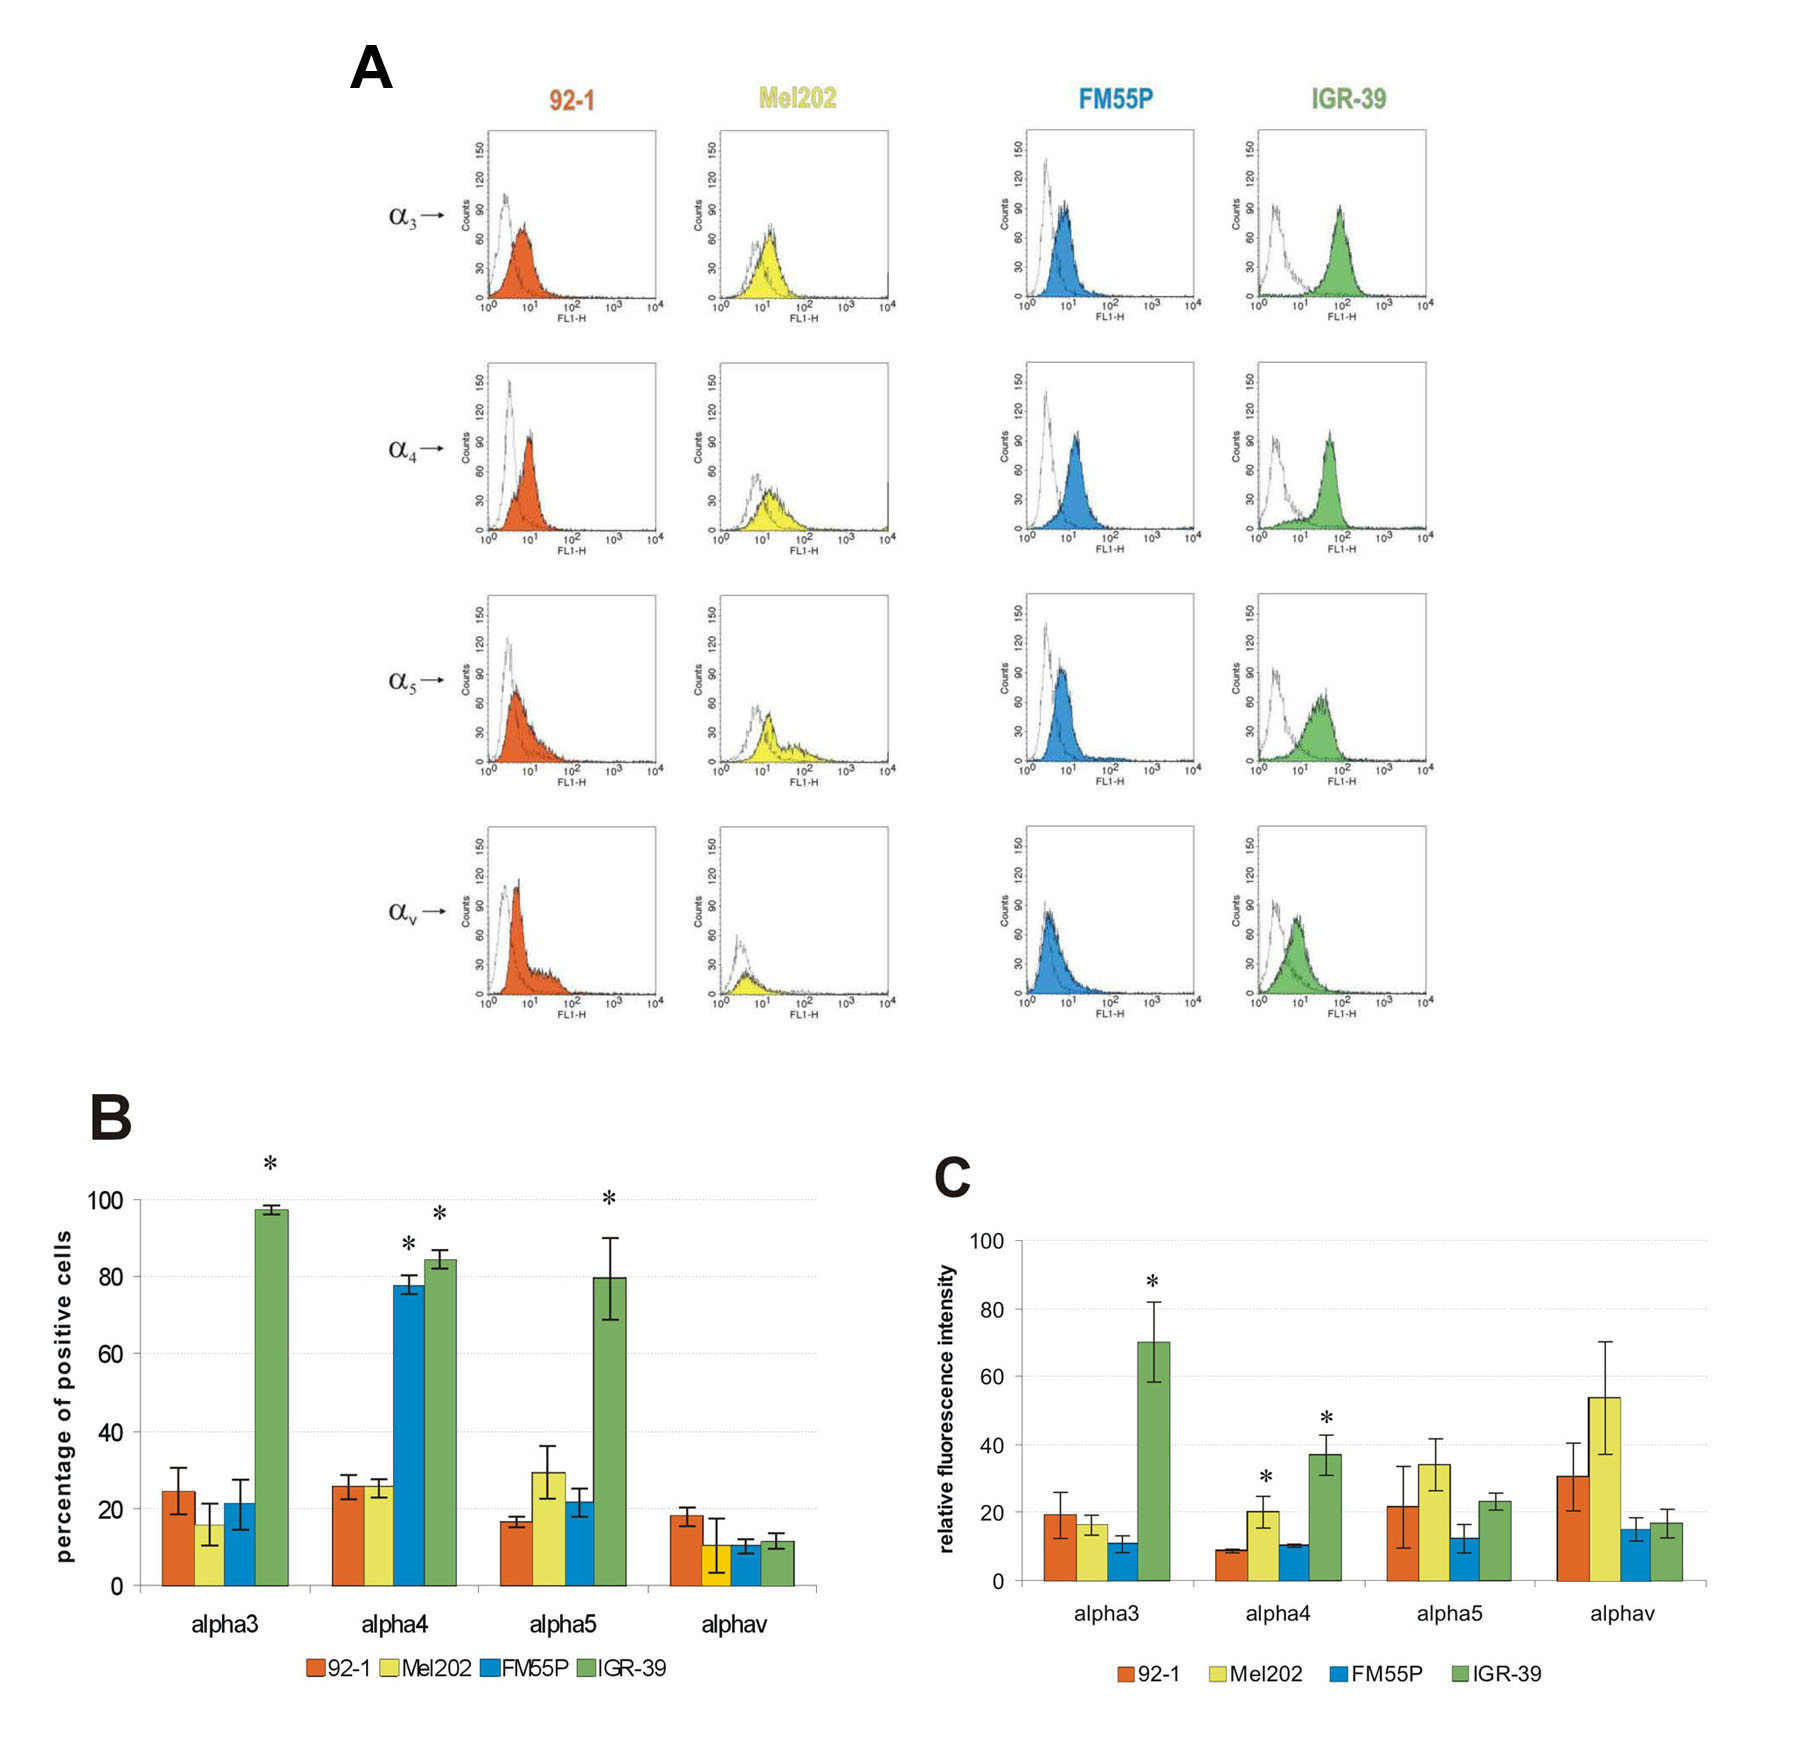
 Figure 3 of
Przybyło, Mol Vis 2008; 14:625-636.
Figure 3 of
Przybyło, Mol Vis 2008; 14:625-636.