Figure 6. Detectable loss in electroretinogram following intracameral inoculation. Positive control (positive c.), negative control
(negative c.), and inoculated mice were compared. Full-field scotopic ERG examinations were performed on treated eyes (■)
versus untreated contralateral eyes (◯) on day 8 post inoculation (A). ERG responses were evaluated by mean b-wave amplitudes (uVolts) at each flash intensity (0.01 mcd⋅s/m2 to 10000 cd⋅s/m2). B max values calculated from nonlinear regressions used for Mann-Whitney U statistical analysis (B). Asterisk (*) indicates a p value ≤ 0.05.
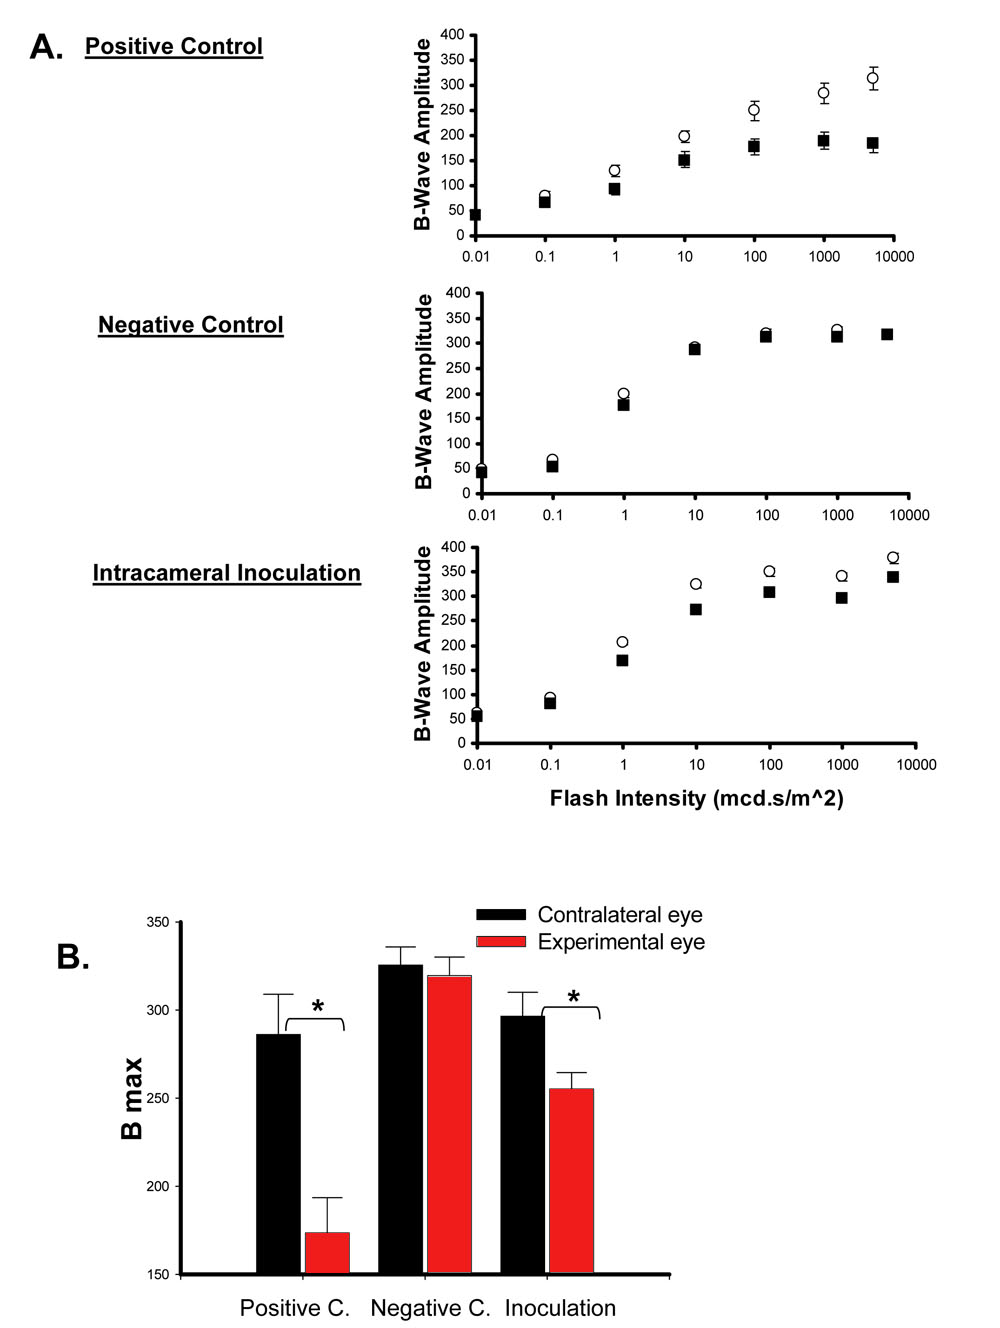
 Figure 6 of
Saban, Mol Vis 2008; 14:615-624.
Figure 6 of
Saban, Mol Vis 2008; 14:615-624.