Figure 8. E2F1/E2F5/p130 triple transgenic lens histology and BrdU incorporation assays. A-B: At E15.5, the E2F1 single (A) and E2F1/E2F5/p130 triple transgenic lenses (B) showed similar defects in fiber cell elongation, plus the presence of extra condensed nuclei in the center of the lenses.
C-D: However, the number of BrdU positive fiber cells in the triple transgenic lens (D) had decreased by 80% when compared to the E2F1 single transgenic lens (C). Scale bars=500 μm.
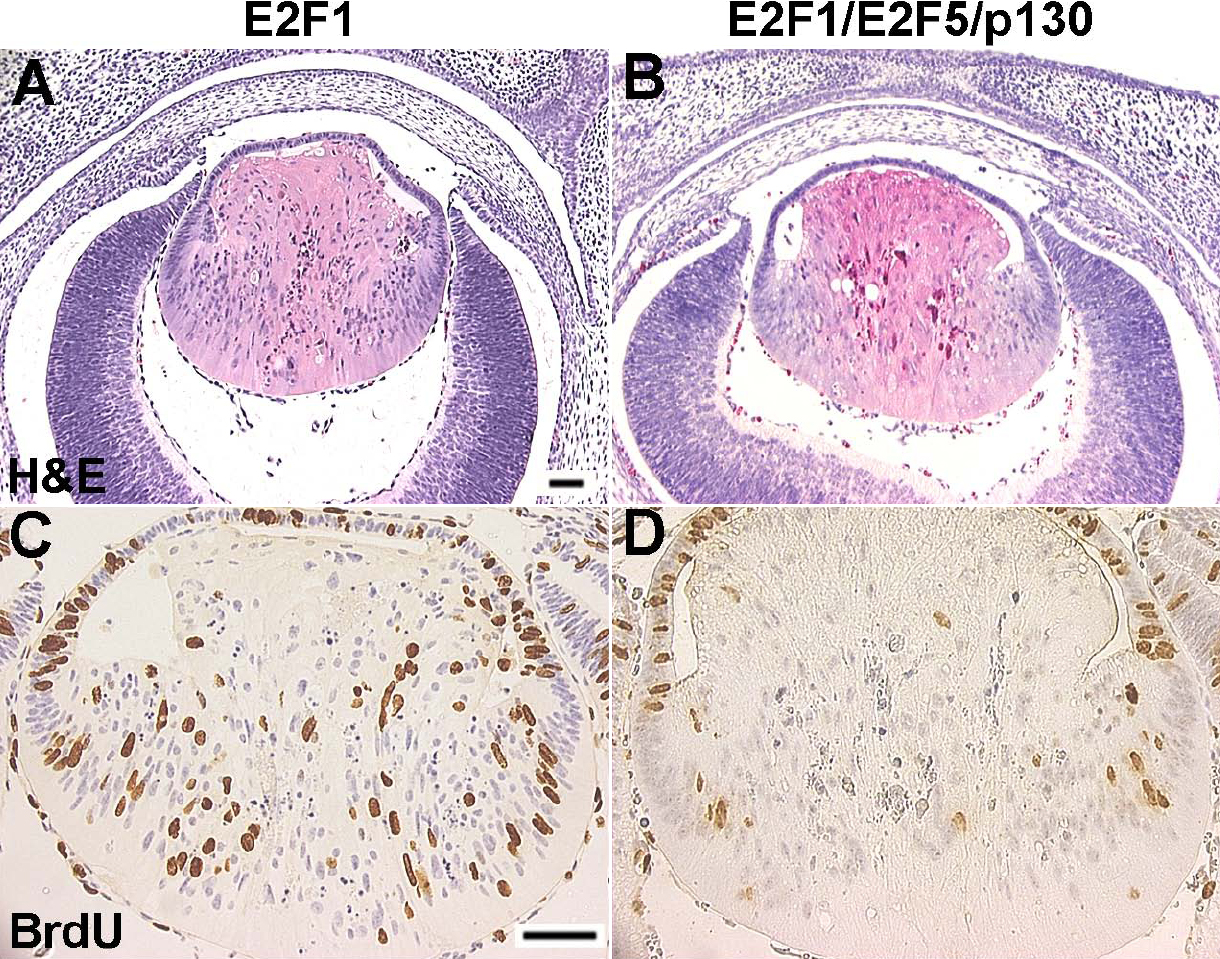
 Figure 8 of
Chen, Mol Vis 2008; 14:602-614.
Figure 8 of
Chen, Mol Vis 2008; 14:602-614.