Figure 6. Distribution of MLBs. A: An example of one of the many volumes examined is shown. This particular volume from an age-related nuclear cataract is
73 µm (x) by 73 µm (y) by 16 µm (z) for a total volume of approximately 85,000 µm3. The z distance of 16 µm resulted from the stacking of 40 optical sections of 0.4 µm each. MLBs appear as bright spots as
their lipid coatings are labeled well by the lipophilic DiI. B: To facilitate the viewing of MLBs, a sphere has been placed manually over each MLB with the aid of thresholding to locate
most of the MLBs. C: With the membranes removed, it can be seen that 64 MLBs are located within this volume of 85,000 µm3 – a frequency of 753,000 MLBs per mm3.
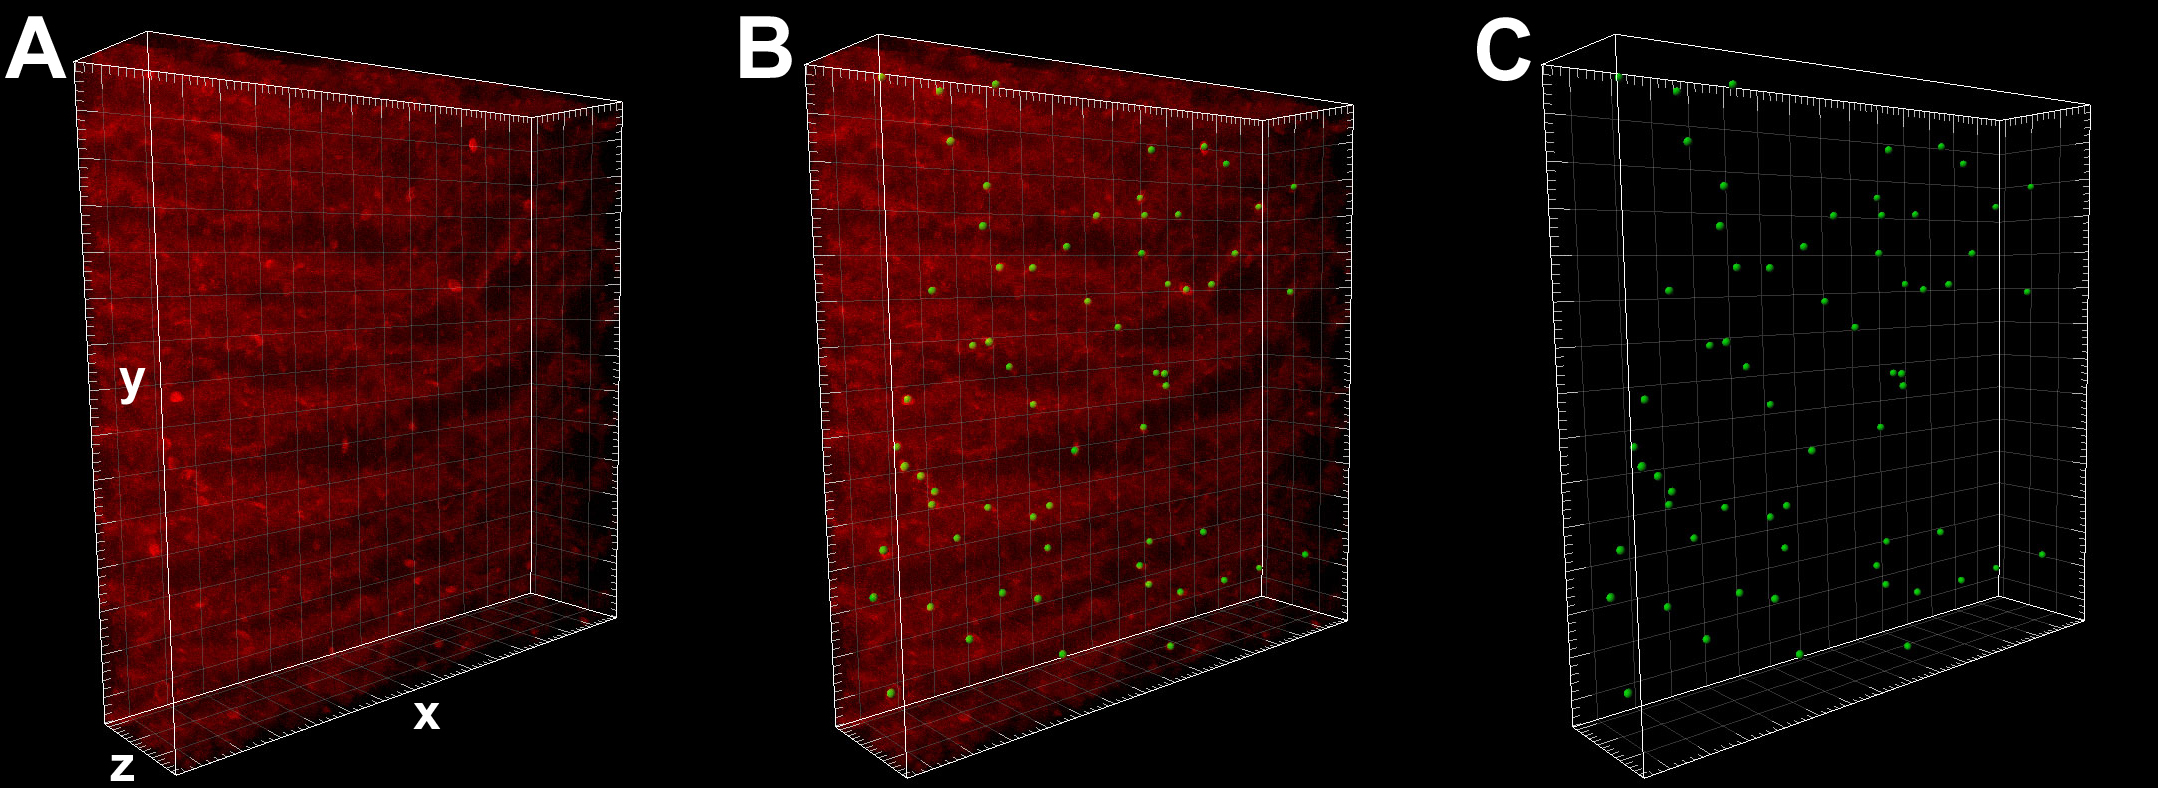
 Figure 6 of
Gilliland, Mol Vis 2008; 14:572-582.
Figure 6 of
Gilliland, Mol Vis 2008; 14:572-582.