Figure 5. Randomness of MLBs by Monte Carlo analysis. Each position of 92 MLBs within a rectangular volume was determined with x, y,
and z coordinates. The distance between each MLB and all other MLBs was then measured, and the nearest neighbor distances
are displayed on this cumulative histogram (red line) and compared with the upper and lower bounds of the histograms created
by 100 and 1000 random repetitions (solid and broken lines) of analyzing the same number of random particles in the same size
volume. This pairwise distribution analysis shows that MLBs are found with a random distribution that is within the ranges
determined by the Monte Carlo trials.
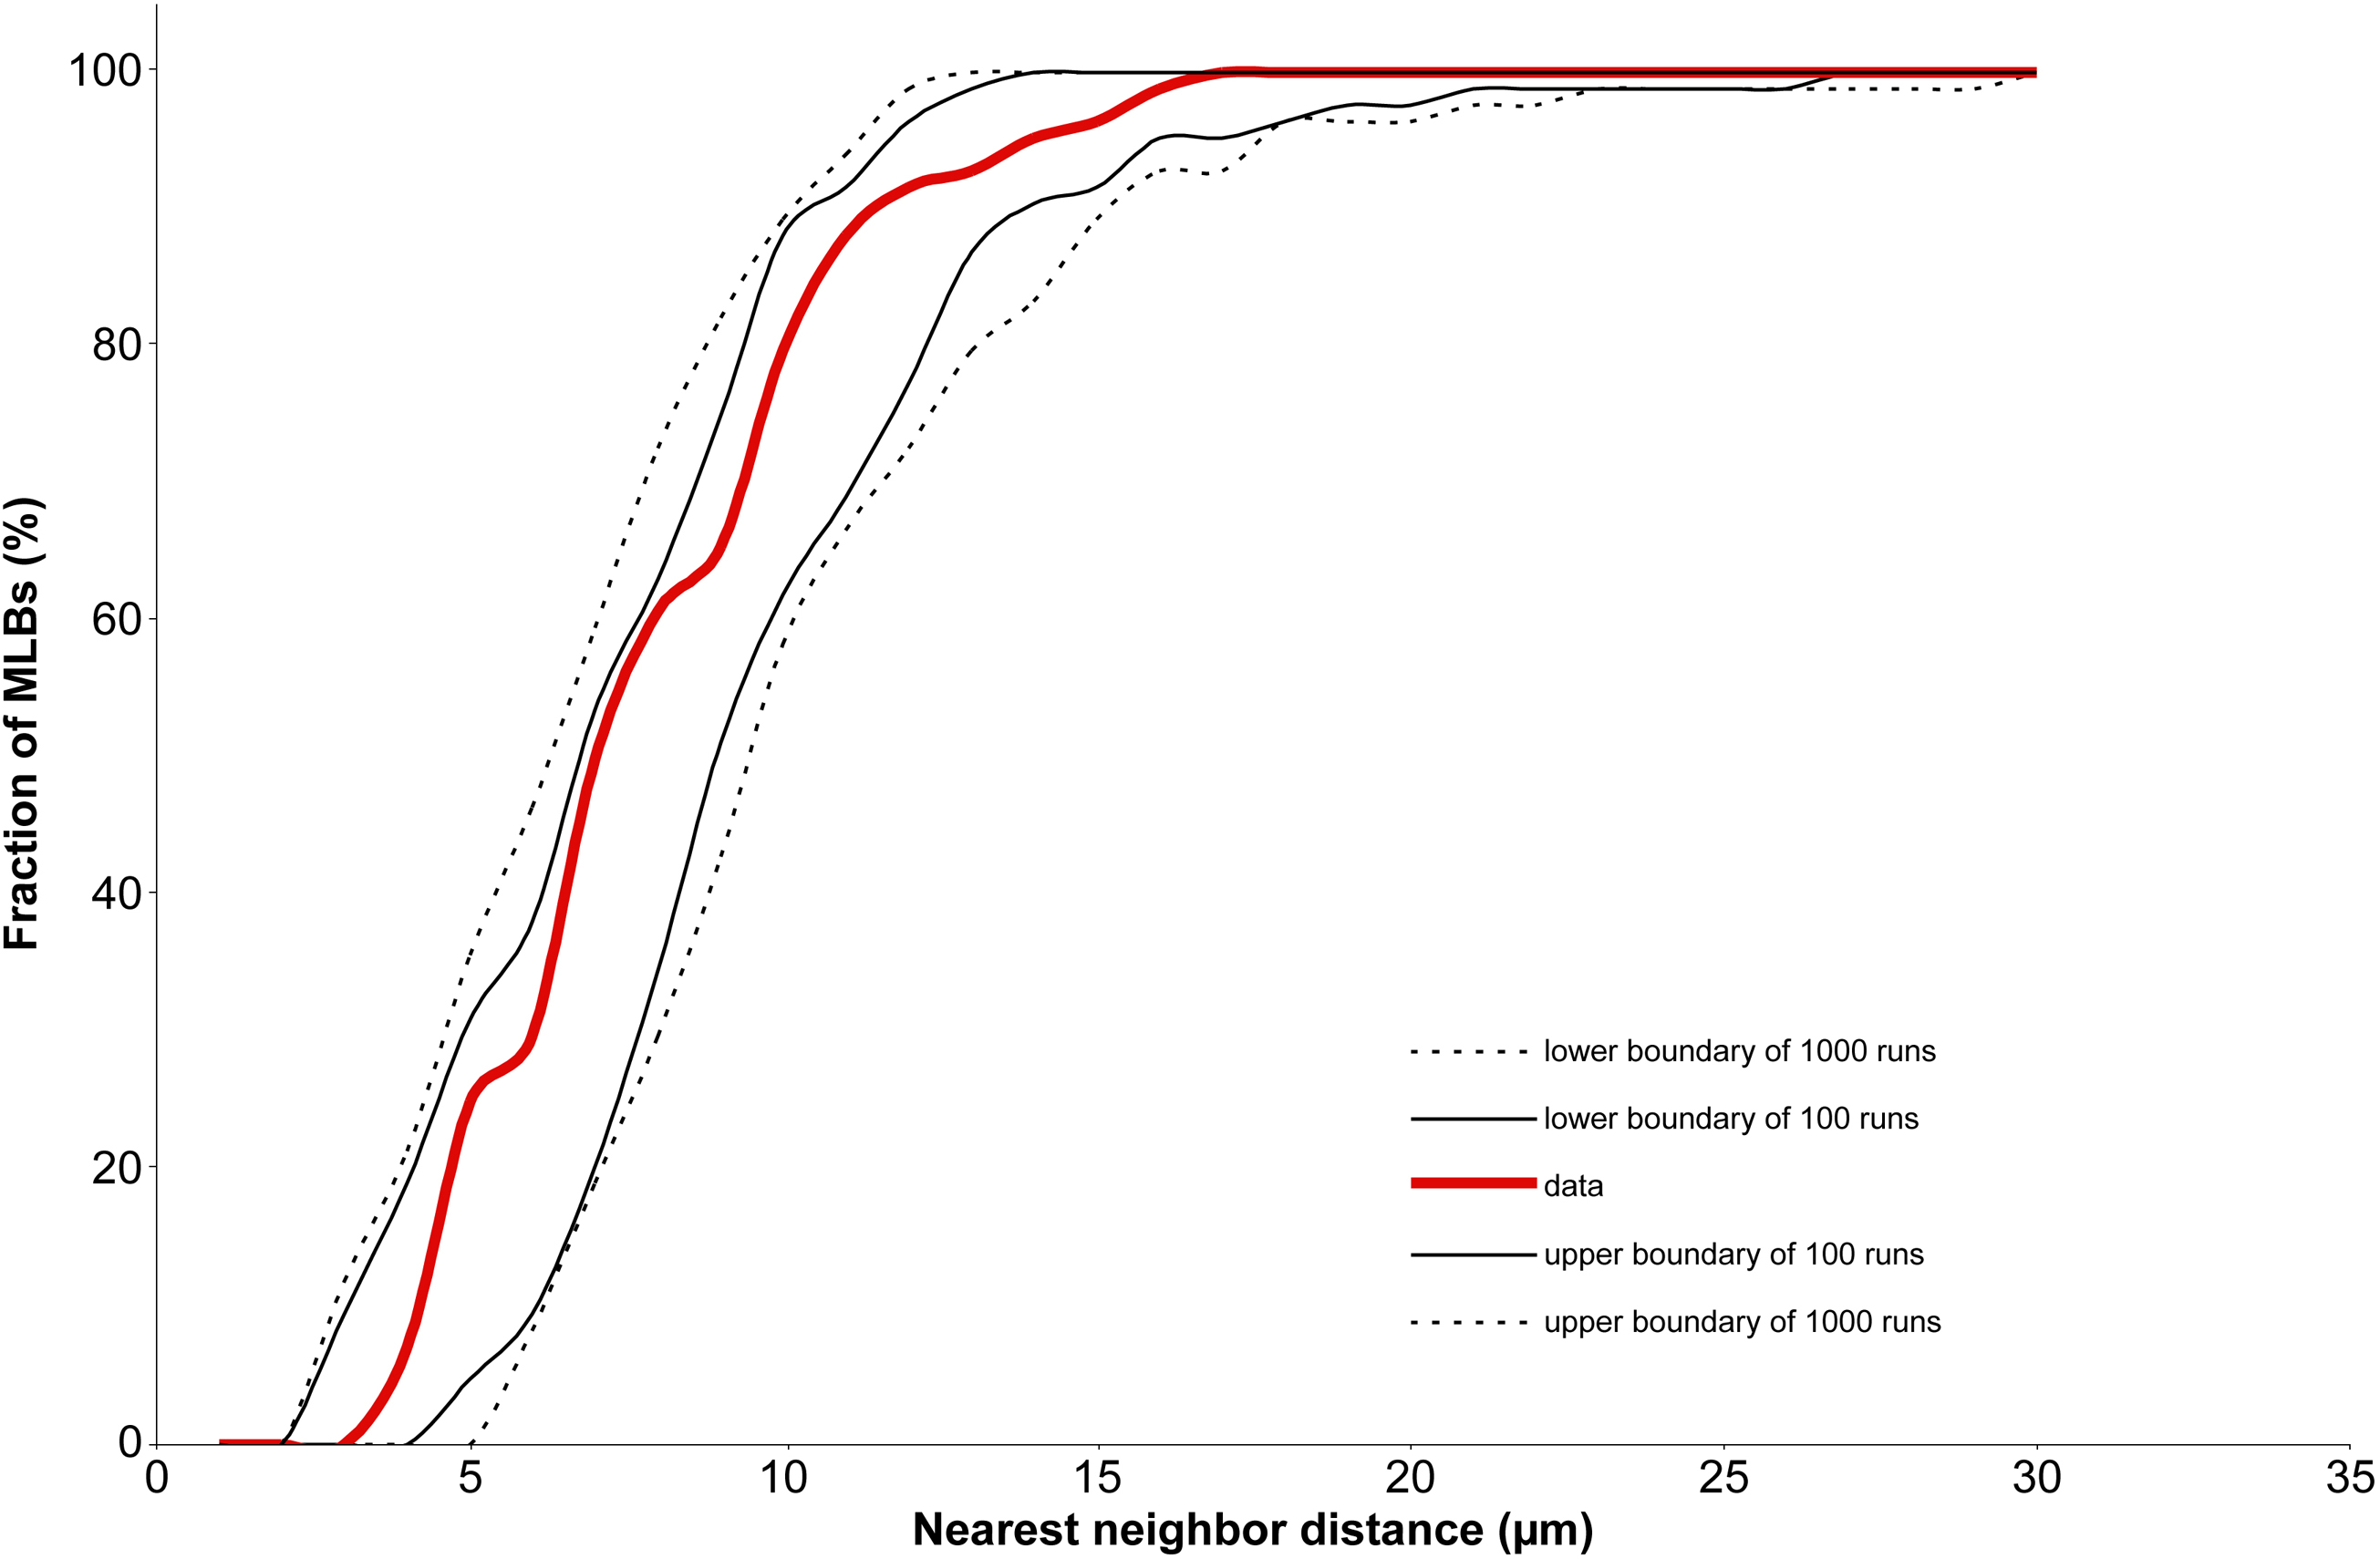
 Figure 5 of
Gilliland, Mol Vis 2008; 14:572-582.
Figure 5 of
Gilliland, Mol Vis 2008; 14:572-582.