Figure 1. A schematic representation of
diagnostic RFLPs (or variable positions sequenced) used to assort mtDNA
haplotypes. Phylogenetic relationships of all the haplogroups detected
in the glaucoma cohort studied are graphically represented. Diagnostic
positions, detected by RFLP or sequencing, are depicted on the branches
relating haplogroups. Positive signs (+) indicate restriction-site
gains and negative signs (-) indicate restriction-site losses.
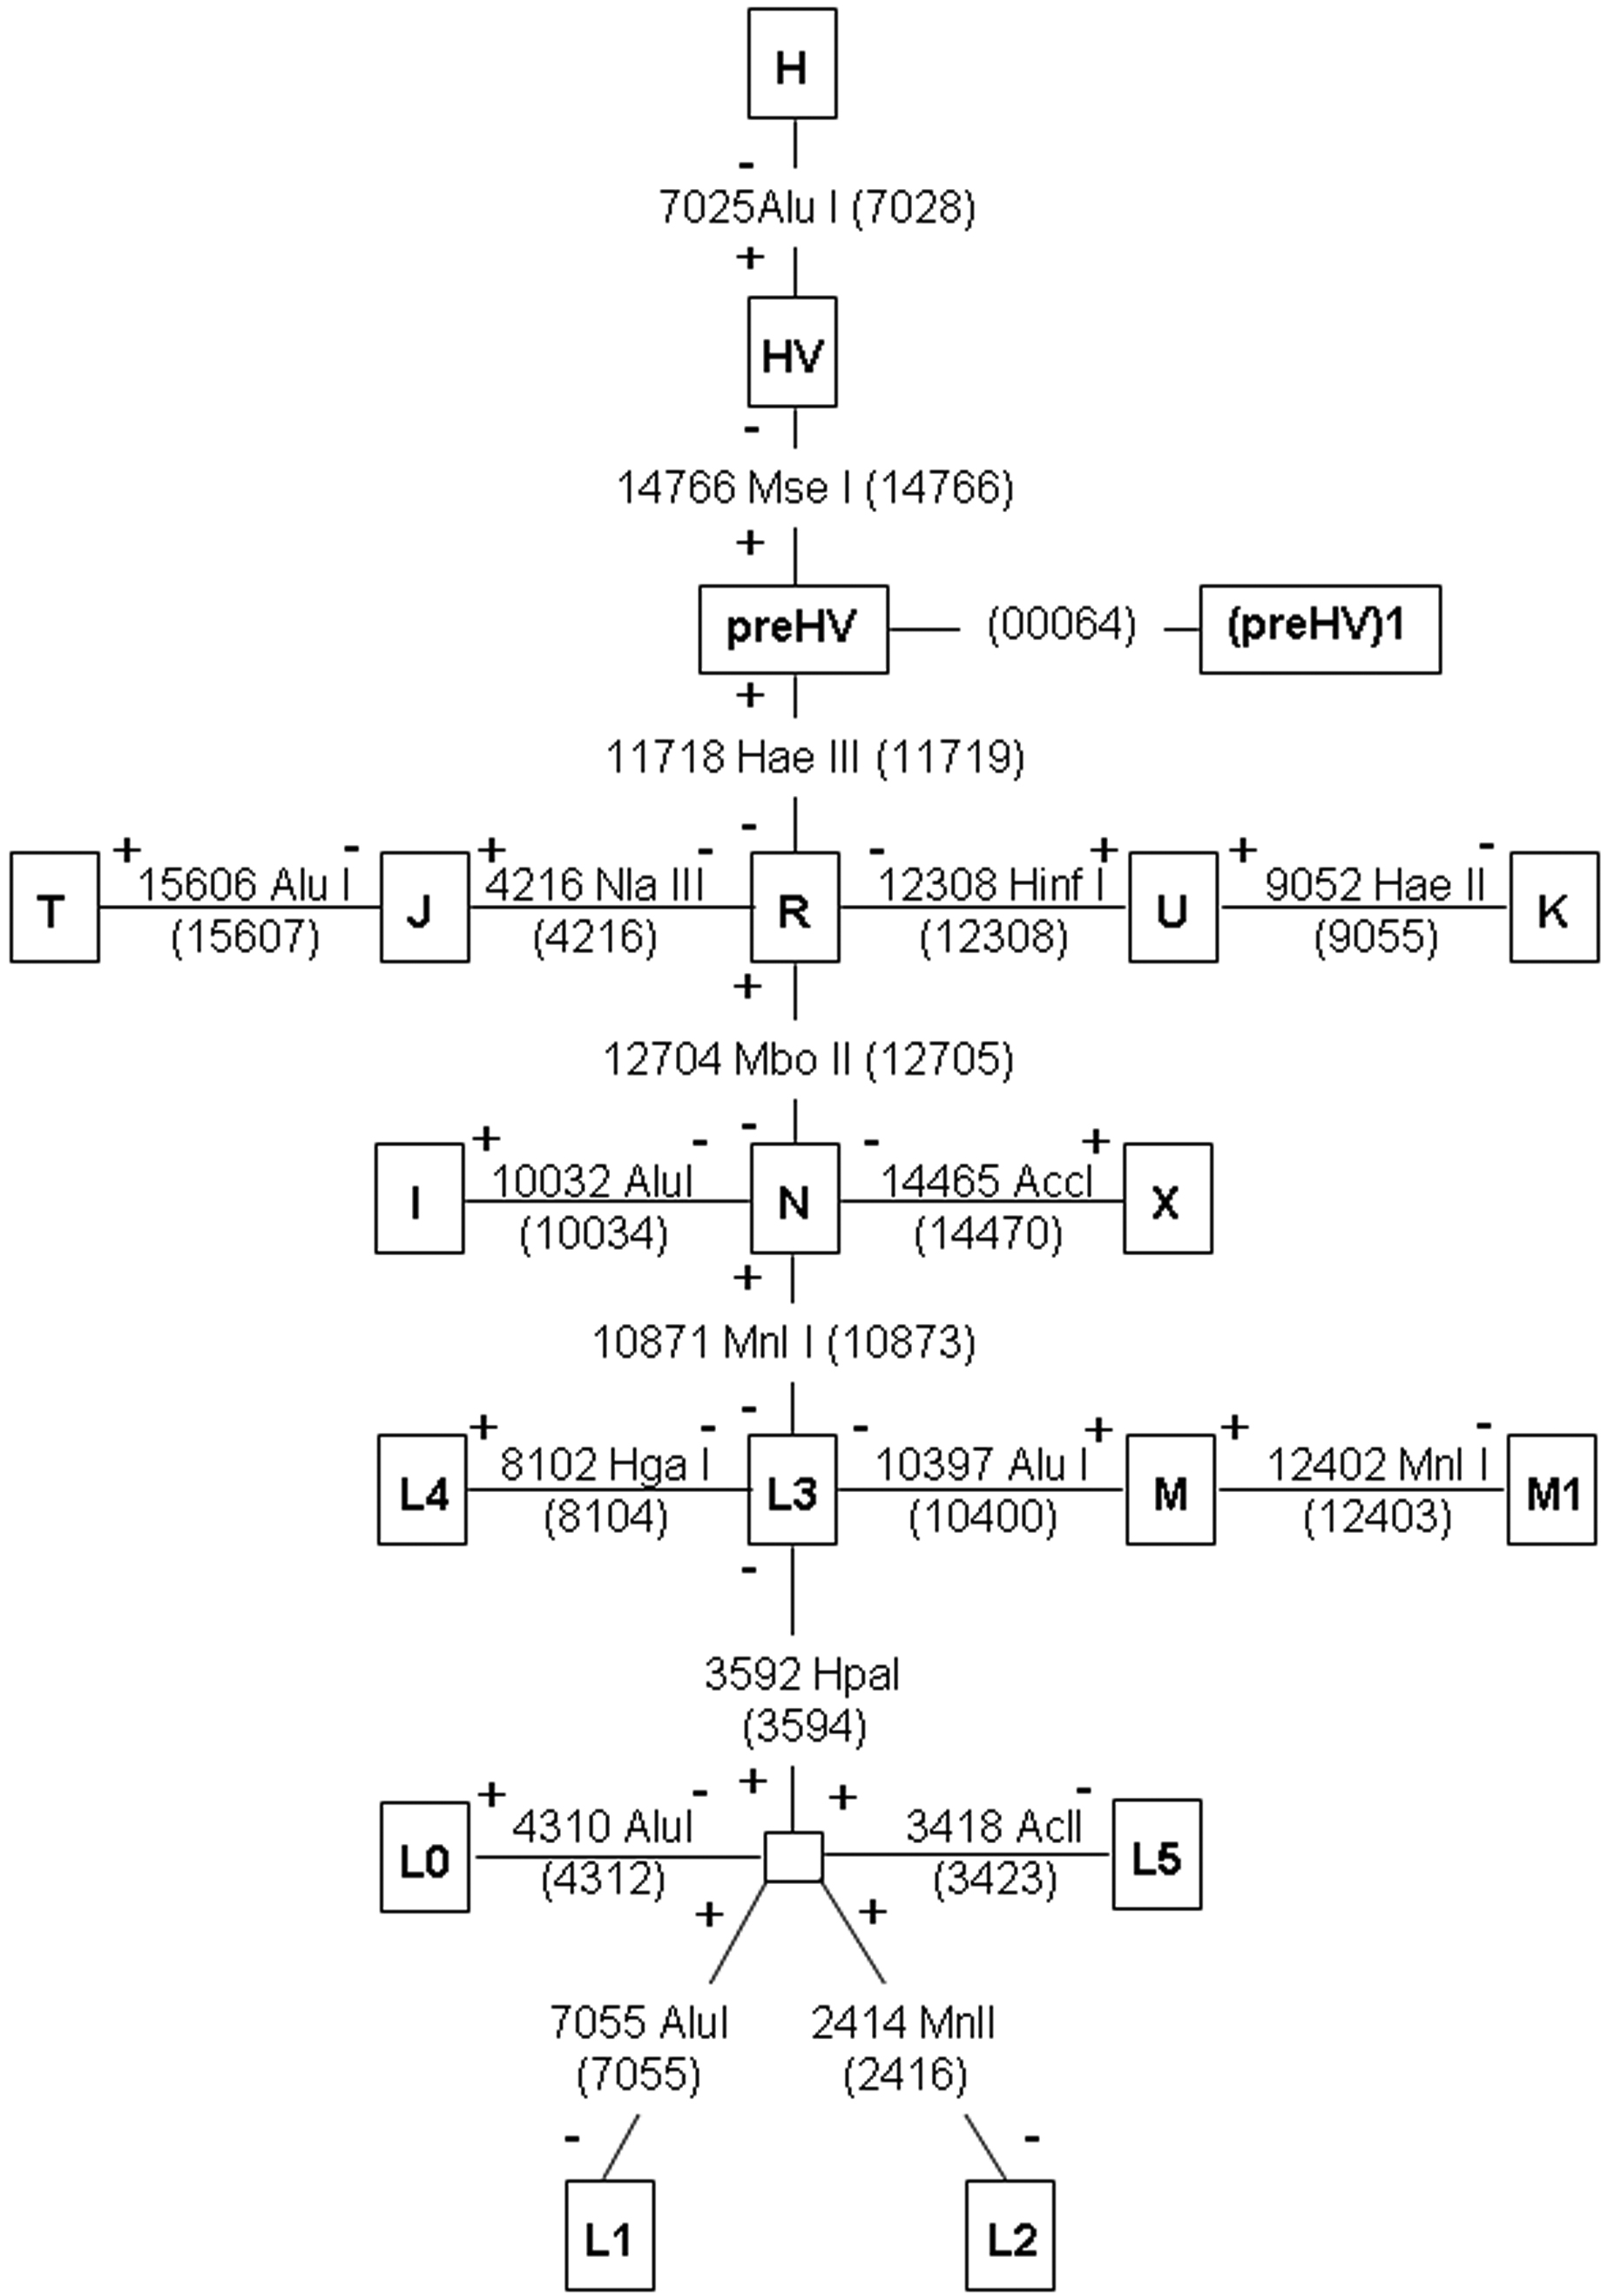
 Figure 1 of Abu-Amero, Mol Vis 2008; 14:518-522.