Figure 3. Comparison of SDS-extracted
proteins derived from the proband and a normal human cornea. The
extracted proteins were analyzed by reduced SDS–PAGE and stained with
coomassie blue. The 64 kDa band in lanes 2 and 3 (see arrow) were
excised, digested with trypsin, and identified as TGFBIp by MALDI mass
spectrometry fingerprint analysis. Lane 1: molecular size markers; Lane
2: normal human cornea; Lane 3: cornea of proband.
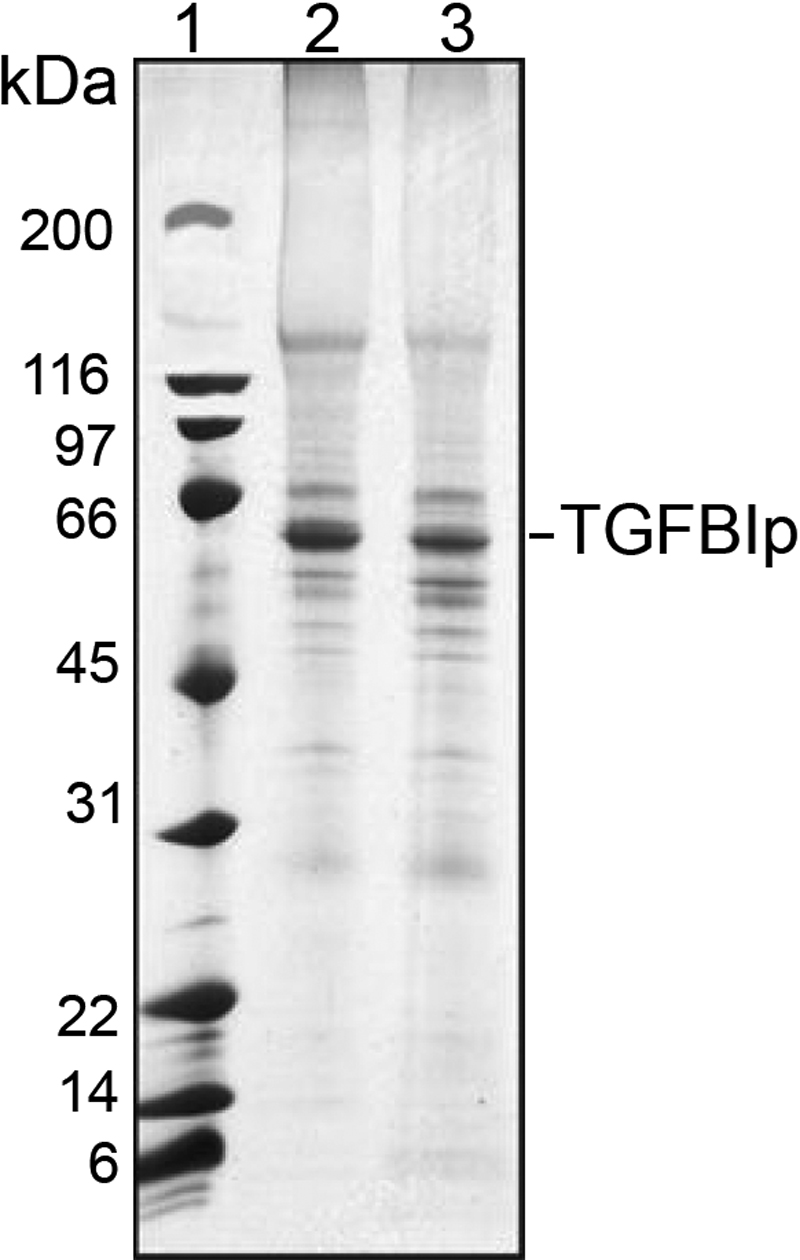
 Figure 3 of Afshari, Mol Vis 2008; 14:495-499.