Figure 3. Mutation analysis of LCA5 gene. A: Sequence chromatogram of the LCA5 gene showing c.955G>A homozygous mutation in the genomic DNA of the affected patient. The homozygous mutation is indicated
by the arrow. B: Sequence chromatogram of the LCA5 gene showing c.955G>A heterozygous change in the genomic DNA of the unaffected father. The heterozygous variation is indicated
by the arrow. C: cDNA sequence of the LCA5 gene of the affected proband with the mutated splice site. The black square box and the arrow indicate the mutated base.
The green dashed box indicates the 5 base insertion of the adjacent intron due to the donor splice site mutation. D: cDNA sequence of a normal control showing the wild type base as indicated by the arrow and the underlined sequence annotation.
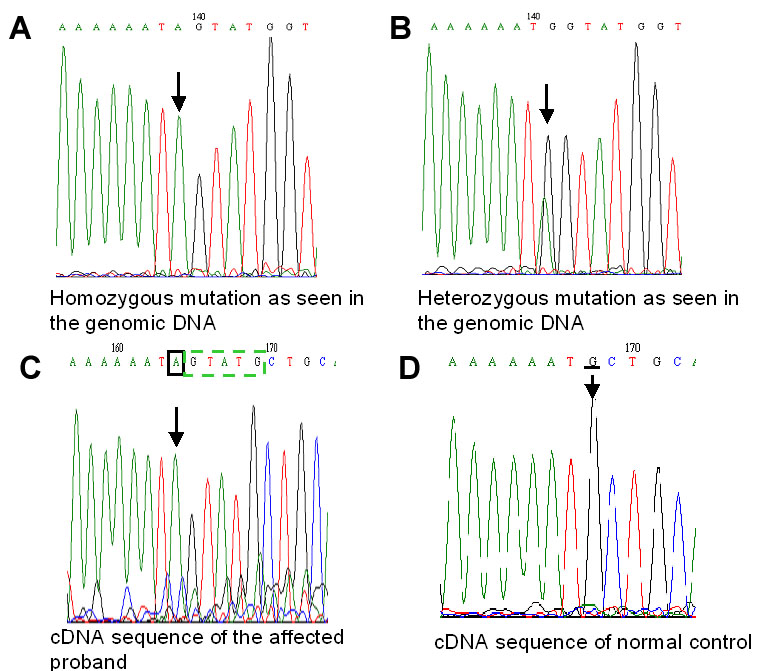
 Figure 3 of
Ramprasad, Mol Vis 2008; 14:481-486.
Figure 3 of
Ramprasad, Mol Vis 2008; 14:481-486.