Figure 9 of
Green-Church, Mol Vis 2008; 14:456-470.
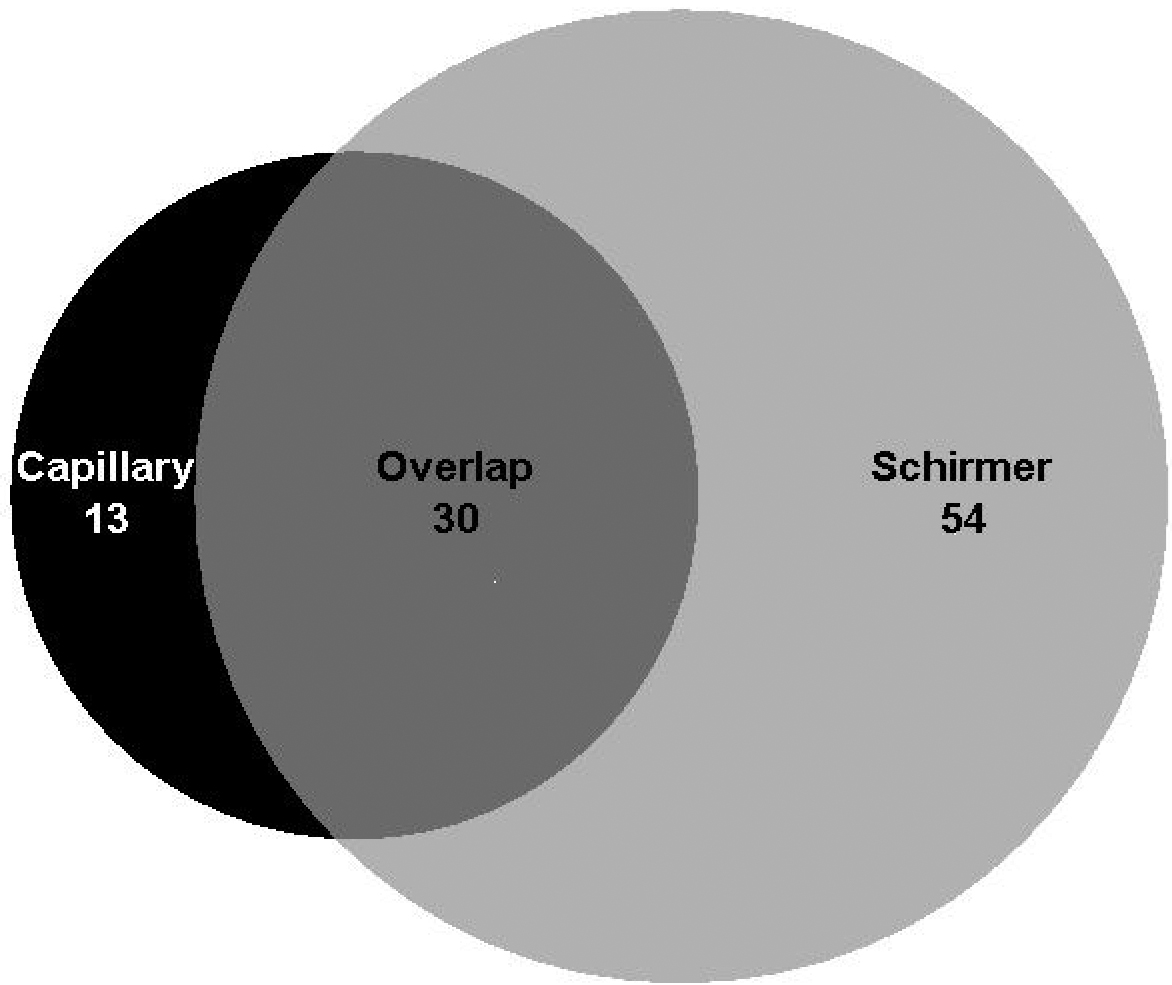
Figure 9.
Venn diagram comparing the distribution envelope of proteins that were collected by capillary versus by Schirmer strip. The proteins were identified using GeLC-MS/MS and MudPIT.
 Figure 9 of Green-Church, Mol Vis 2008; 14:456-470.