Figure 5 of
Green-Church, Mol Vis 2008; 14:456-470.
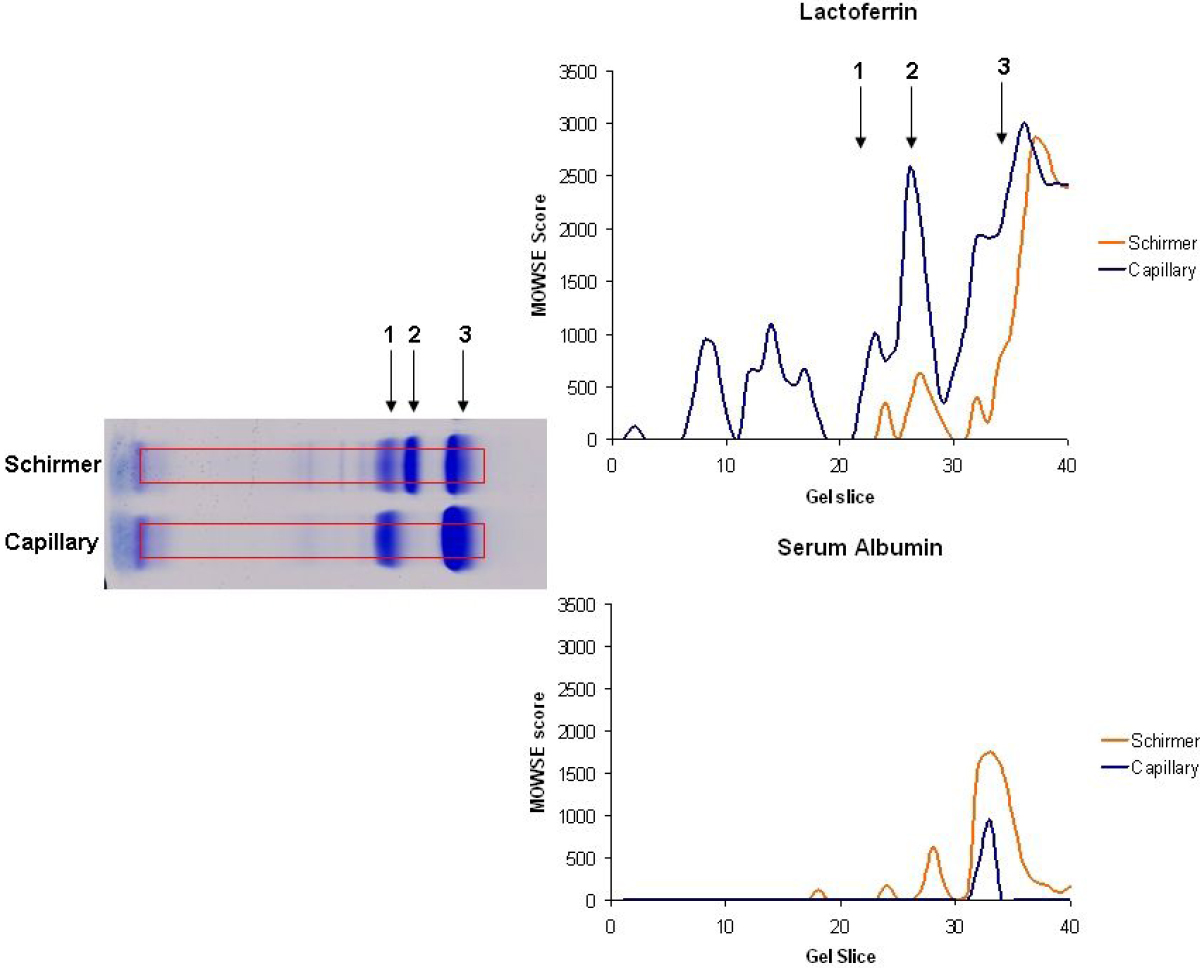
Figure 5.
1D-SDS–PAGE of coomassie stained lactoferrin and serum albumin. Shown is a graph of gel slice versus Mowse score of lactoferrin and serum albumin to determine what protein is the dominating factor from the gel band.
 Figure 5 of Green-Church, Mol Vis 2008; 14:456-470.