Figure 4 of
Green-Church, Mol Vis 2008; 14:456-470.
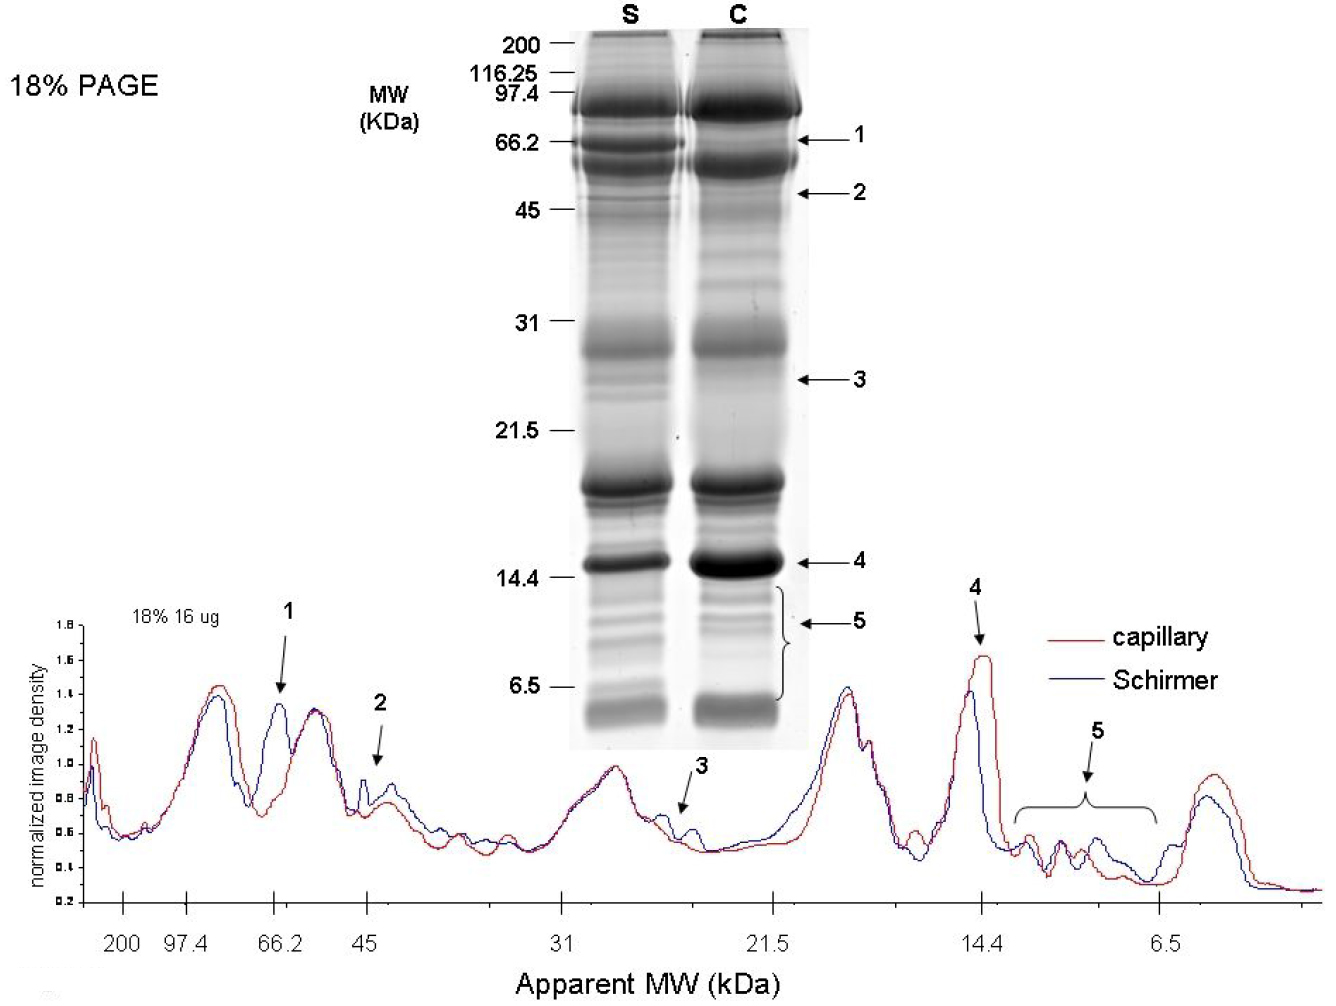
Figure 4.
18% 1D-SDS–PAGE of coomassie stained proteins optimized for lower molecular weight proteins. The gel band intensities were profiled and the region with observable differences was identified.
 Figure 4 of Green-Church, Mol Vis 2008; 14:456-470.