Figure 7. Reverse transcription polymerase chain reaction analysis of limbal mesenchymal cells and MSC-BM. The figure shows the expression
profiles of selected markers in MSC-BM (M), MC-L (L), and LECs (E) as well as the negative control (-ve). MSC-BM and MC-L
show negative expression profiles of p63 (1387 bp), corneal cytokeratins, K3 (150 bp) and K12 (193 bp), integrin α9 (123 bp),
EGFR (484 bp), and PAX−6 (208 bp) in comparison to LECs. The figure also shows a positive expression of connexin 43 (150 bp)
and α-enolase (619 bp) by stromal cells of both origin similar to LECs and an expression of p75 by MSC-BM and LECs (230 bp).
The above expression studies have been normalized using GAPDH (498 bp) as the internal control.
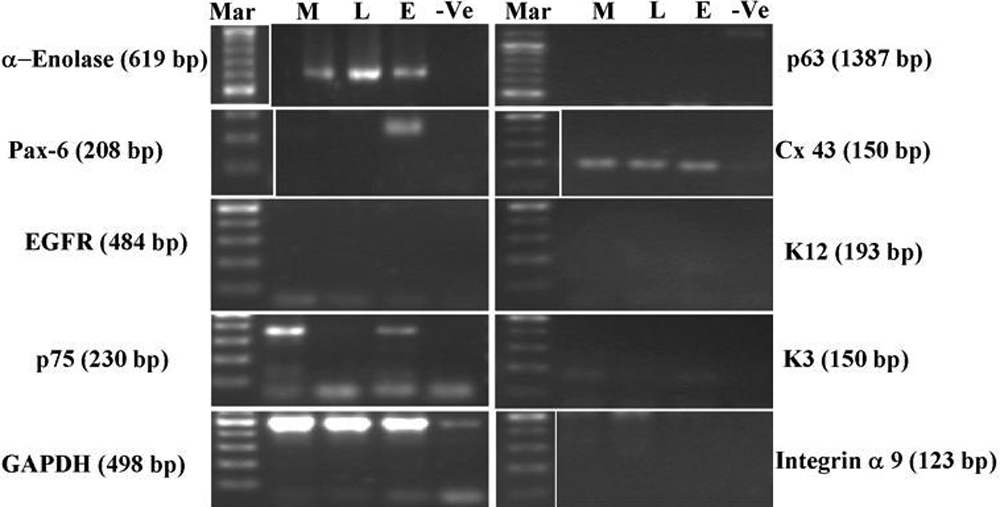
 Figure 7 of
Polisetty, Mol Vis 2008; 14:431-442.
Figure 7 of
Polisetty, Mol Vis 2008; 14:431-442.