Figure 7. Alteration of DNA content analysis on Chang (WKD) and IOBA-NHC cells The alteration of DNA content was measured through the
sub-G1 peak flow analysis (flow cytometry) on Chang (WKD) and IOBA-NHC cells after 15 min of cell exposure with the different concentrations
of BAC followed by 24 h of cell recovery. Note that the same toxicity profiles were obtained on both cell lines with BAC concentration-dependent
cell toxicity. The asterisk symbols denote statistically significant differences between the two cell lines (**p<0.001, *p<0.01).
BAC, benzalkonium chloride; PBS, phosphate buffered saline. Means ± SEM.
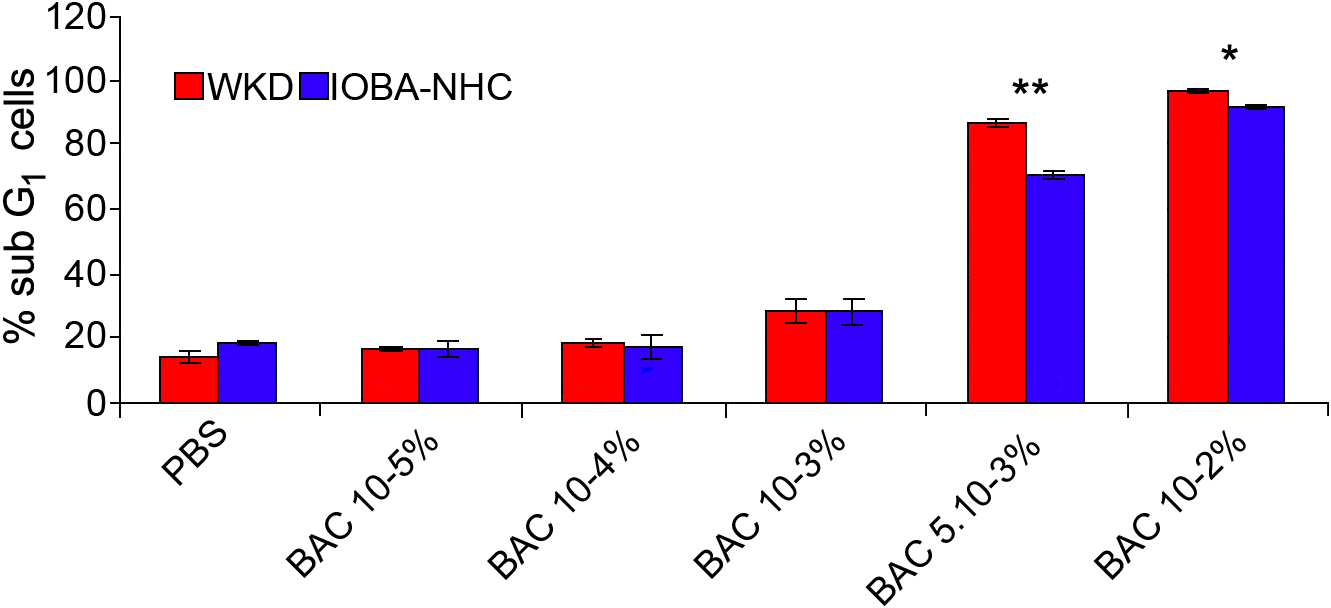
 Figure 7 of
Brasnu, Mol Vis 2008; 14:394-402.
Figure 7 of
Brasnu, Mol Vis 2008; 14:394-402.