Figure 5. Total toxic effect evaluation using the Annexin/V-7AAD staining on Chang (WKD) and IOBA-NHC cells. This figure shows the total
toxic effect (apoptotic and necrotic cells) using the Annexin/V-7AAD test (flow cytometry) after 15 min of treatment with
different concentrations of BAC on Chang (WKD) and IOBA-NHC cells. Note that the same toxicity profiles were obtained on both
cell lines with BAC concentration-dependent cell toxicity. The asterisk symbols denote statistically significant differences
between the two cell lines (**p<0.001, *p<0.05). BAC, benzalkonium chloride; PBS, phosphate buffered saline. Means ± SEM.
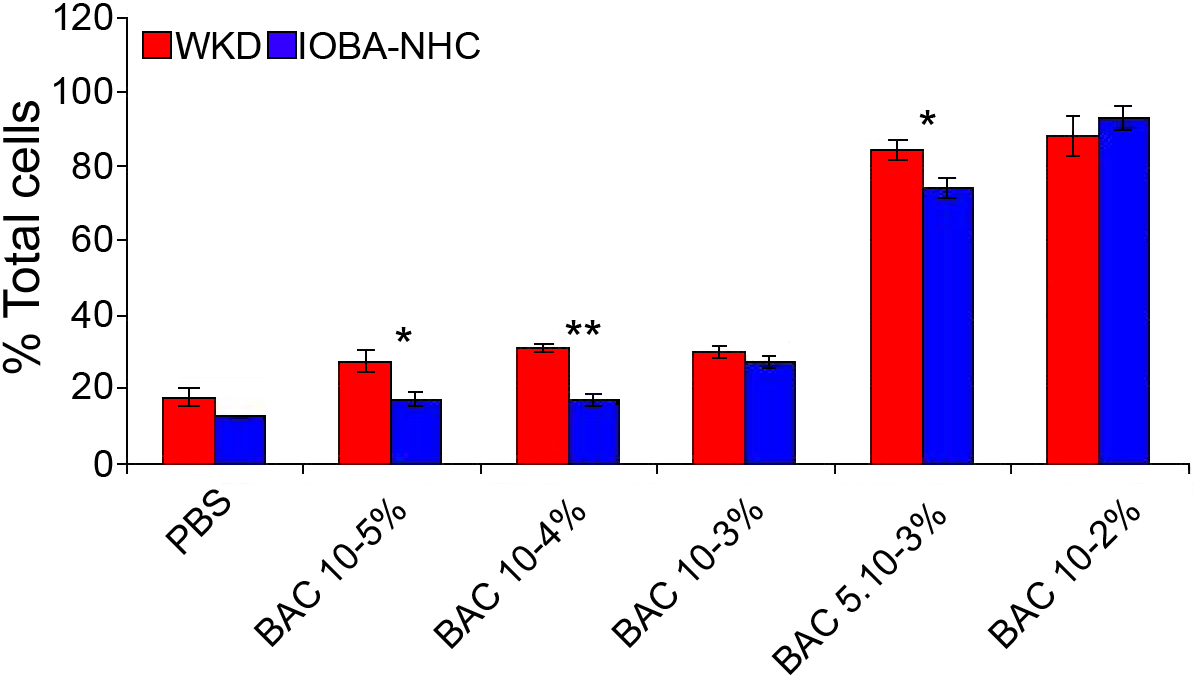
 Figure 5 of
Brasnu, Mol Vis 2008; 14:394-402.
Figure 5 of
Brasnu, Mol Vis 2008; 14:394-402.