Figure 4. Apoptosis assay using the Yopro-1 test on Chang (WKD) and IOBA-NHC cells. This figure shows the results of the Yopro-1 apoptosis
assay (microplate cytofluorometry) on Chang (WKD) and IOBA-NHC cells after two incubation times, 15 min of treatment with
different BAC concentrations (WKD 15 min, IOBA-NHC 15 min) and 15 min of treatment with different BAC concentrations followed
by 24 h of cell recovery in complete medium (WKD 24 h, IOBA-NHC 24 h). Note that the Yopro-1/neutral red ratio that is correlated
to cell apoptosis consistently increased with BAC concentration on both cell lines. The asterisk symbols denote statistically
significant differences between the two cell lines after 15 min of treatment (**p<0.001, *p<0.01), and the sharps (hash mark)
denote statistically significant differences between the two cell lines after 24 h of cell recovery(##p<0.001, #p<0.05). BAC
benzalkonium chloride; PBS, phosphate buffered saline. Means ± SEM.
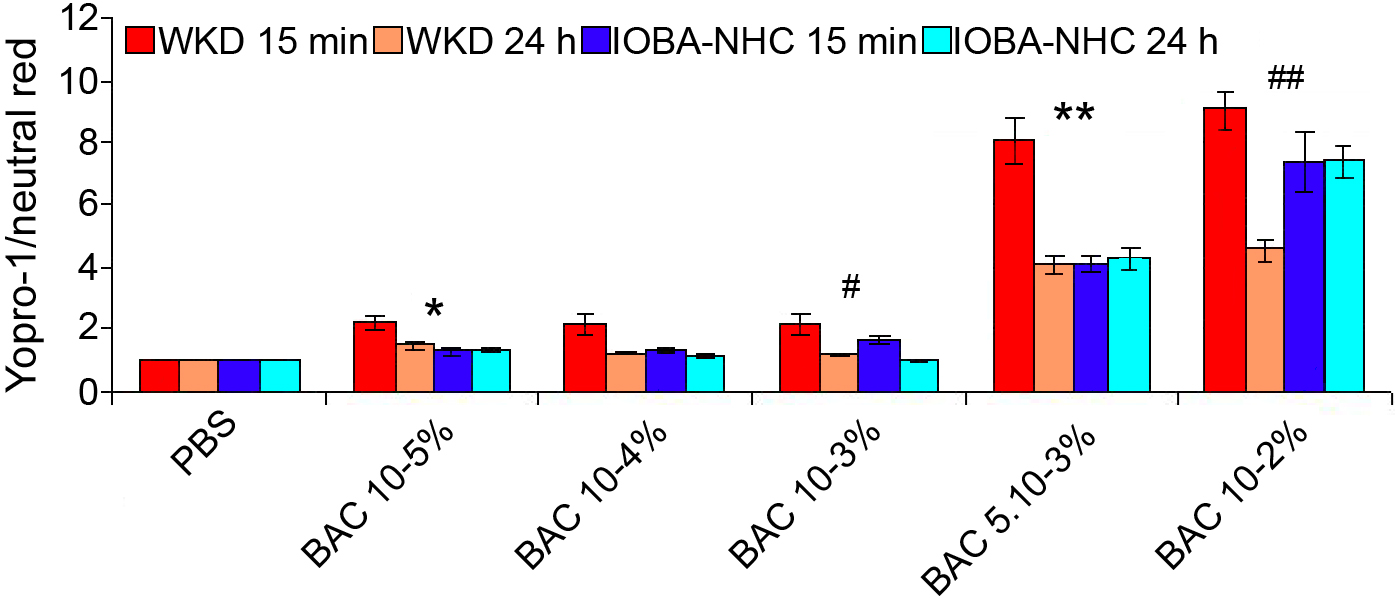
 Figure 4 of
Brasnu, Mol Vis 2008; 14:394-402.
Figure 4 of
Brasnu, Mol Vis 2008; 14:394-402.