Figure 2. Reactive oxygen species detection using the H2DCF-DA test on Chang (WKD) and IOBA-NHC cells. This figure shows the reactive oxygen species (ROS) detection using the H2DCF-DA test (microplate cytofluorometry) on Chang (WKD) and IOBA-NHC cells after two incubation times, 15 min of treatment
with different BAC concentrations (WKD 15 min, IOBA-NHC 15 min) and 15 min of treatment with different BAC concentrations
followed by 24 h of cell recovery in complete medium (WKD 24 h, IOBA-NHC 24 h). Note that the highest ROS production was obtained
with the highest BAC concentrations and varied in a concentration-dependent manner on both cell lines. The asterisk symbol
denotes statistically significant differences between the two cell lines after 15 min of treatment (*p<0.01), and the sharps
(hash mark) denote statistically significant differences between the two cell lines after 24 h of cell recovery (##p<0.001,
#p<0.01). BAC, benzalkonium chloride; PBS, phosphate buffered saline. Means ± SEM.
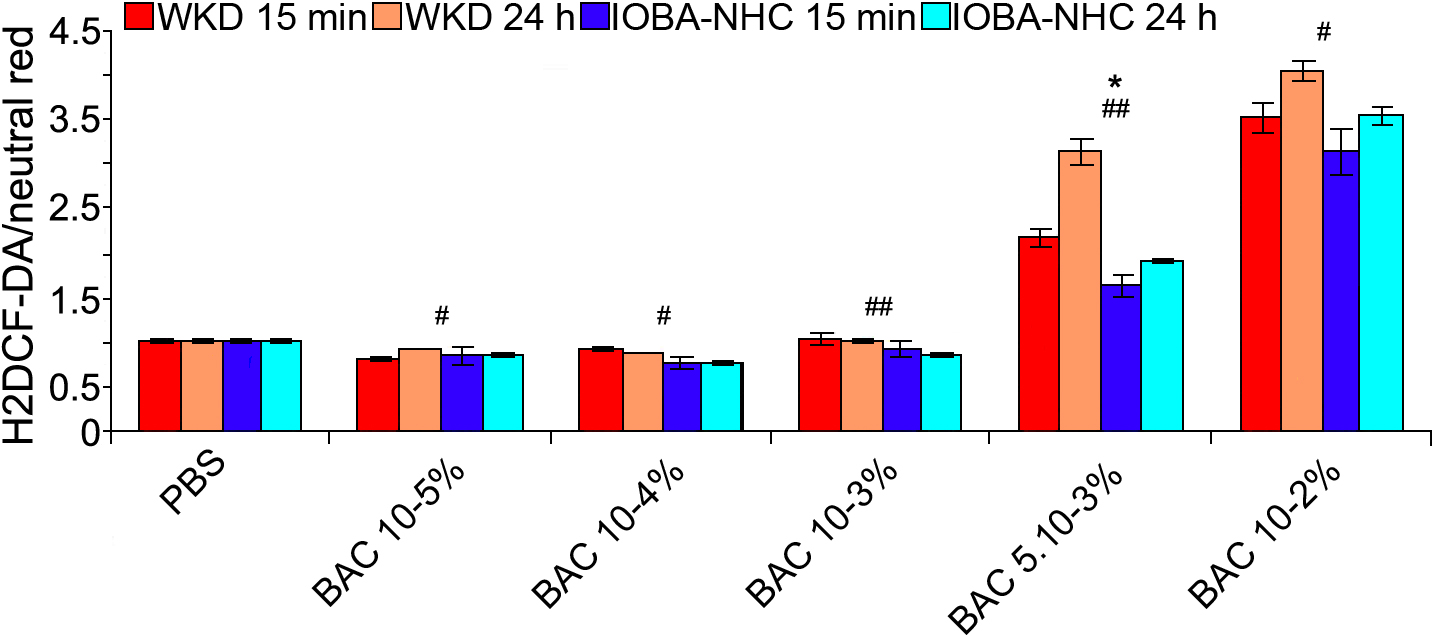
 Figure 2 of
Brasnu, Mol Vis 2008; 14:394-402.
Figure 2 of
Brasnu, Mol Vis 2008; 14:394-402.