Figure 6. Flow cytometry analysis of CD4+CD25+Foxp3+T cells. Flow cytometry analysis of CD4+CD25+Foxp3+T cells per 1×10⁶ splenocytes in mice from different groups. The mice in
the groups listed as AC-injection 24h, 48h, 72h, 120h, normal controls, and PBS controls were as same as described in Figure
2. Spleens from different groups were removed 7 days after s.c. immunization and used for preparing a single-cell suspension.
The cells were stained with anti-CD3, anti-CD4, anti-CD25, and anti-Foxp3 mAb. Data in A indicate the percentage of CD25+Foxp3+ cells which derive from gating on CD3+ CD4+ cells. The results shown in the histogram
(B) are the mean SEM (n=6 per group). The asterisk indicates that p<0.05 when compared with the positive control.
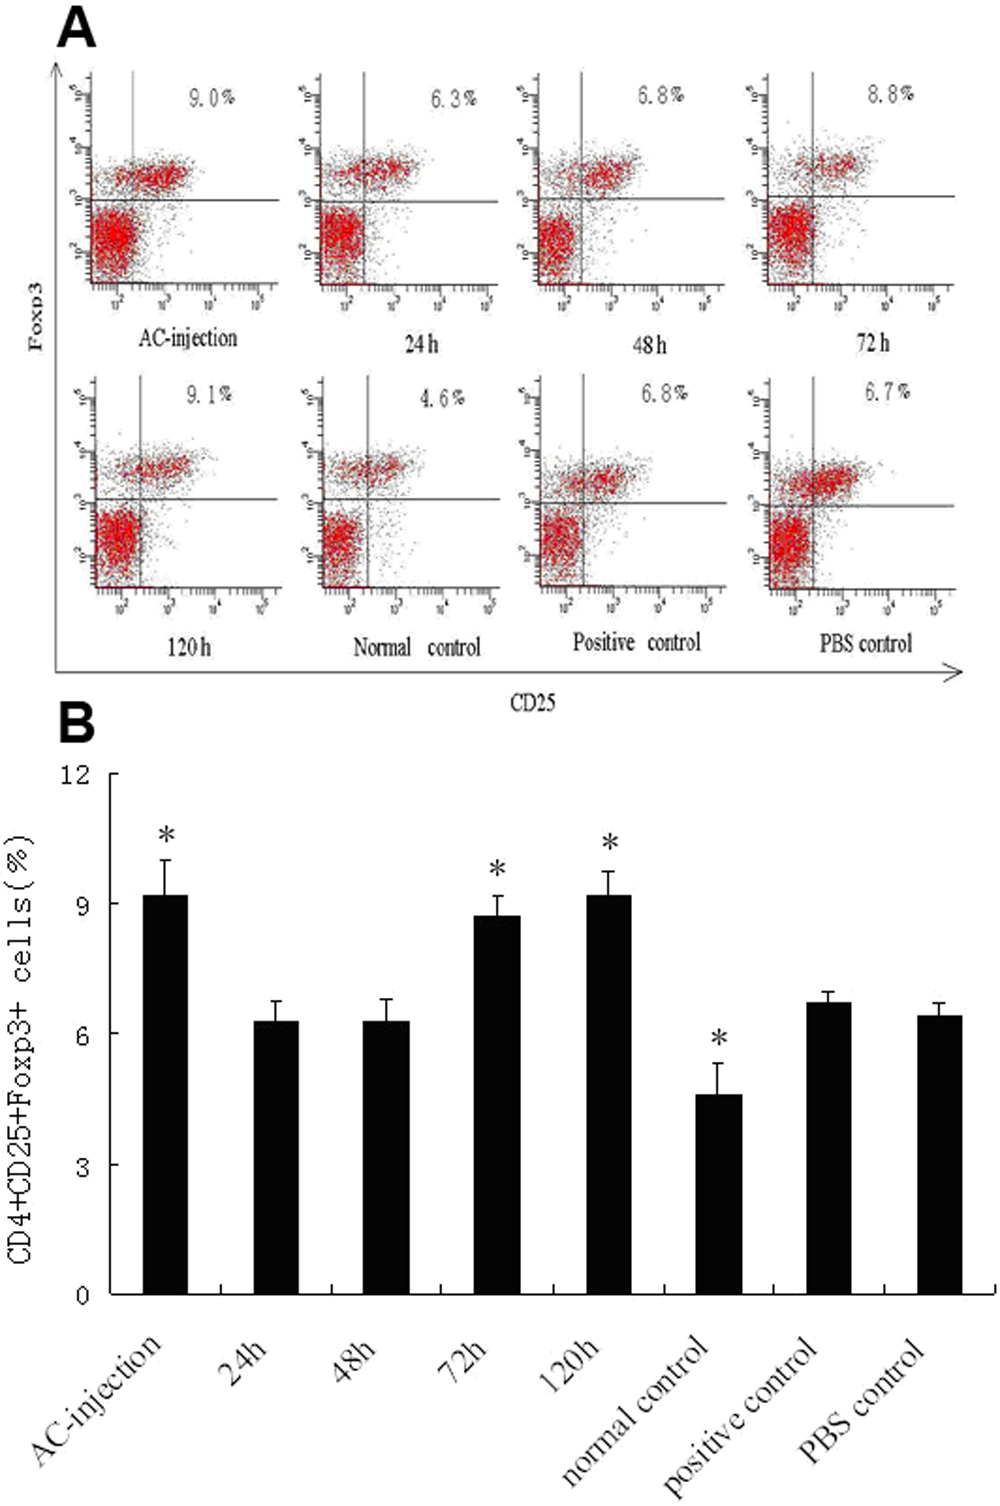
 Figure 6 of
Lei, Mol Vis 2008; 14:327-333.
Figure 6 of
Lei, Mol Vis 2008; 14:327-333.