Figure 2. Western blot analyses of AQP4 in
chick retina and rat brain. A. Western blots of retinal tissue
from three normal chicks (lanes 1 and 2) and brain tissue from four
Hooded Wistar rats (lanes 3 and 4) is displayed. Lane 5 is the
molecular weight marker. B shows the western blot analyses of
AQP4 antibody in chick retinae: tissue from left (LE) and right eyes
(RE) of a normal control chick in lanes 1 and 2 alongside tissue from
fellow non-deprived left eye (LE) and form-deprived right eye (RE) of
an experimental chick in lanes 3 and 4. All eyes show a similar band
around 30 kDa. The form-deprived eye appears to display strong bands
for both isoforms of AQP4 at about 30 kDa (indicated by the double
asterisk) and 32 kDa (indicated by a single asterisk). Note that a band
is visible at about 100 kDa and may potentially relate to a tetramer of
AQP4.
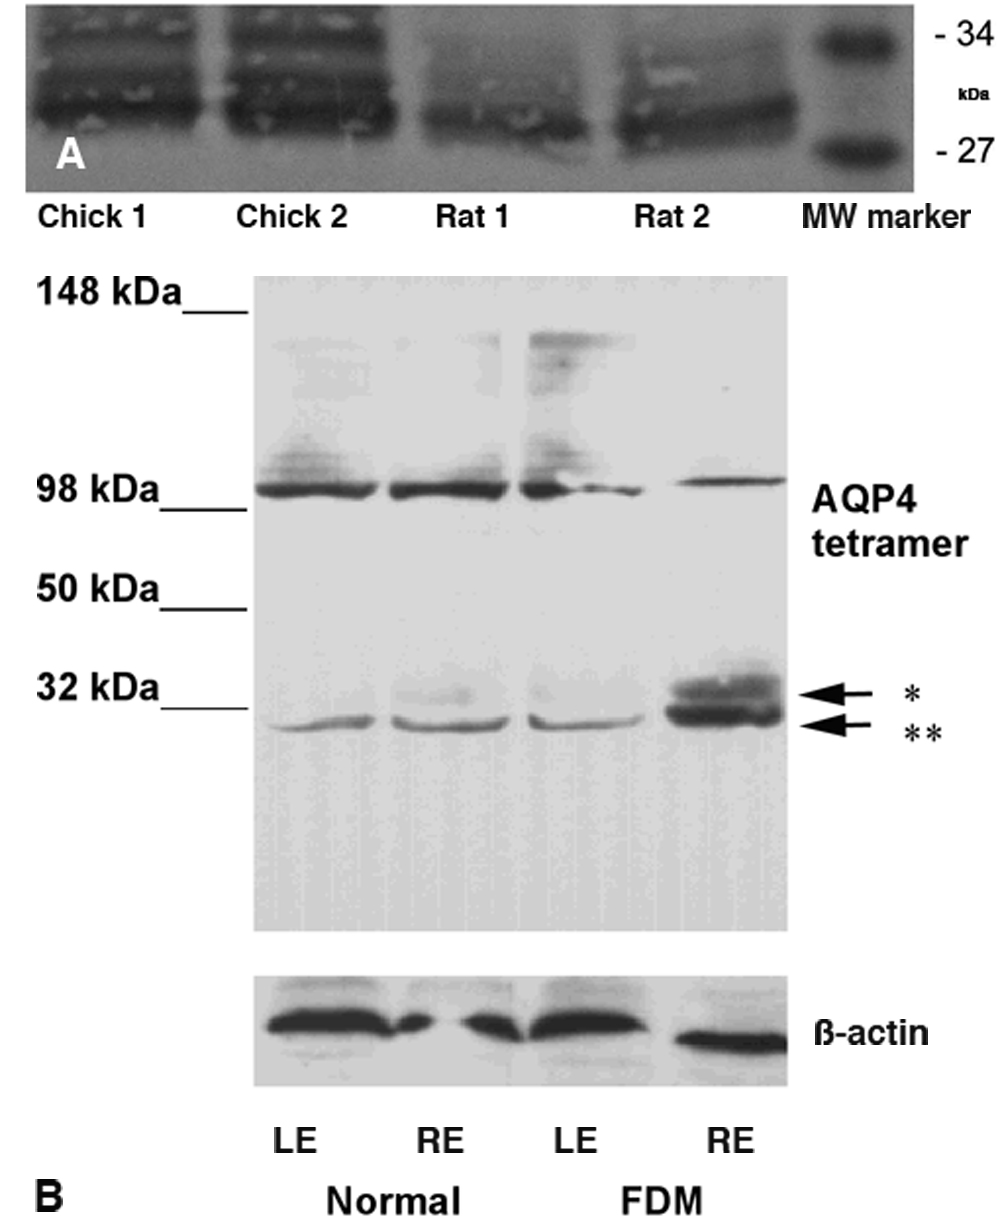
 Figure 2 of Goodyear, Mol Vis 2008; 14:298-307.