![]() Figure 2 of
Su, Mol Vis 2008;
14:268-273.
Figure 2 of
Su, Mol Vis 2008;
14:268-273.
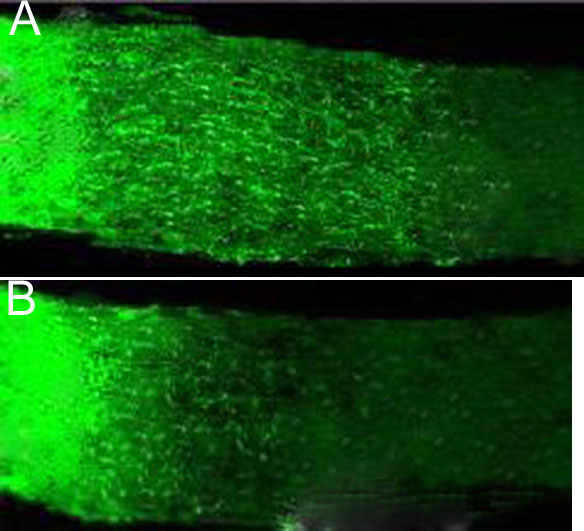
Figure 2. Expression of GAP-43 in experimental group (Nogo-A/B/C knockout mice) and control group (C57BL/6 mice; GAP-43 stain)
A: There is more expression of GAP-43 in experimental group (green fluorescence stain). Regenerated axon can be investigated under immunofluorescence microscope. There was significant difference in stained positive areas on the ON sections between experimental group (Nogo-A/B/C knockout mice) and control groups (C57BL/6 control mice). B: There is less expression of GAP-43 in the control group (GAP-43 stain). The scale bars represent 20 μm.