![]() Figure 1 of
Su, Mol Vis 2008;
14:268-273.
Figure 1 of
Su, Mol Vis 2008;
14:268-273.
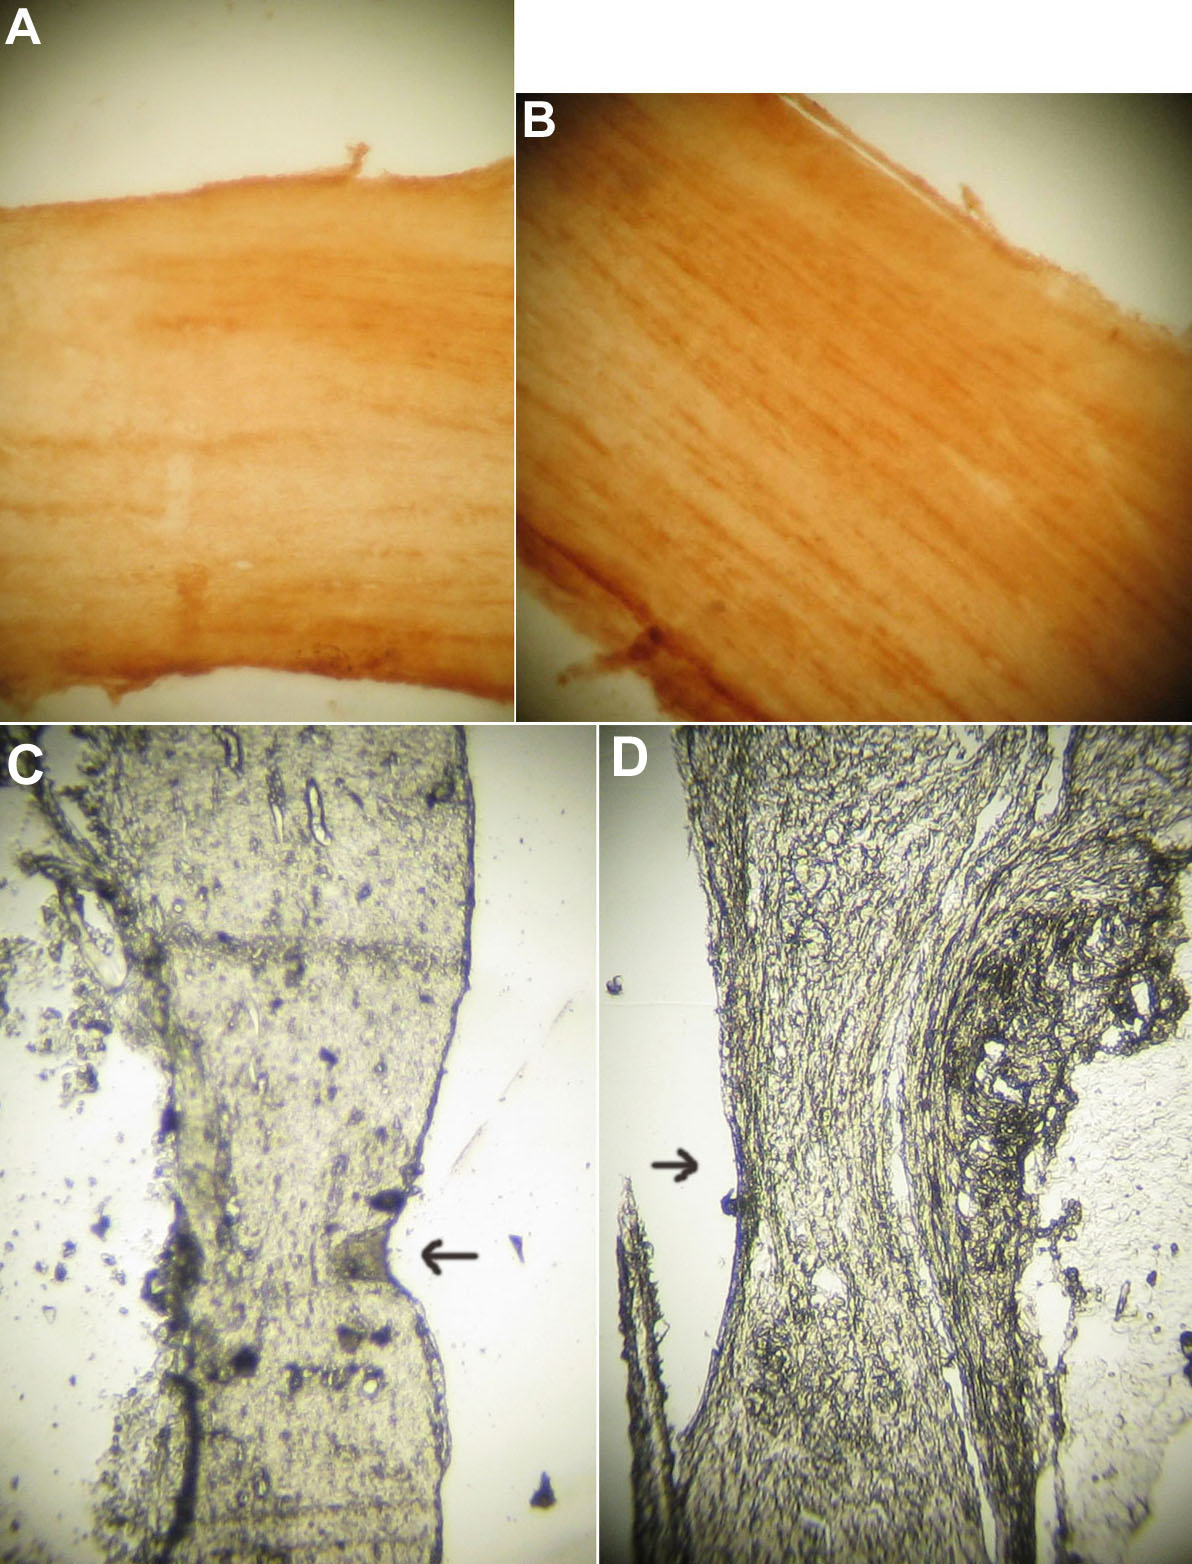
Figure 1. Expression of Nogo-A/B/C mRNA in optic nerve
Expression of Nogo-A/B/C mRNA in optic nerve of experimental group (Nogo-A/B/C knockout mice) and control group (C57BL/6 mice) as visualized by in situ hybridization stained as yellow. Positvie area of stain of Nogo-A/B/C expression of experimental group was 1.36±0.05x102 μm2 whereas that of control group was 26.56±1.25x102 μm2. There was significant difference positvie area of stain of Nogo-A/B/C expression between experimental group and control group(p<0.01). A: Little or no expression of Nogo-A/B/C mRNA was observed in the ON of Nogo-A/B/C-knockout mice. B: Expression of Nogo-A/B/C mRNA was demonstrated in the ON of young adult normal mice. The scale bars represents 20 μm. C: The crush position (arrow) of optic nerve of experimental group (Nogo-A/B/C knockout mice) can be investigated under normal light microscopy. The scale bars represent 20 μm. D: The crush position (arrow) of optic nerve of control group(C57BL/6 control mice) can be investigated under normal light microscopy. The scale bars represent 20 μm.