Figure 4. Blockade of glutamate receptor activation blocks OPA1 release in ischemic rat retina. A: The OPA1 protein bands observed at 80 kDa in cytosolic fraction and at 80 and 90 kDa forms in mitochondrial fraction of
normal retina. Following ischemia, there were at least 4 major isoforms of OPA1 protein bands (90:L, 80:S1, ~75:S2, and ~65 kDa:S3)
in the cytosolic fraction. B: Relative intensity of chemiluminescence for each protein band was normalized using actin as cytosolic fraction calibrator
and VDAC as mitochondrial fraction calibrator. The isoforms of OPA1 protein (L and S3) were significantly increased in the
cytosolic fraction and decreased in the mitochondrial fraction at 12 h after ischemia. Pretreatment with MK801 significantly
blocks OPA1 release to the cytosol and increased OPA1 protein in the mitochondria at 12 h following ischemia. Error bars represent
the standard deviation (*p<0.05 by Student’s t-test, n=3).
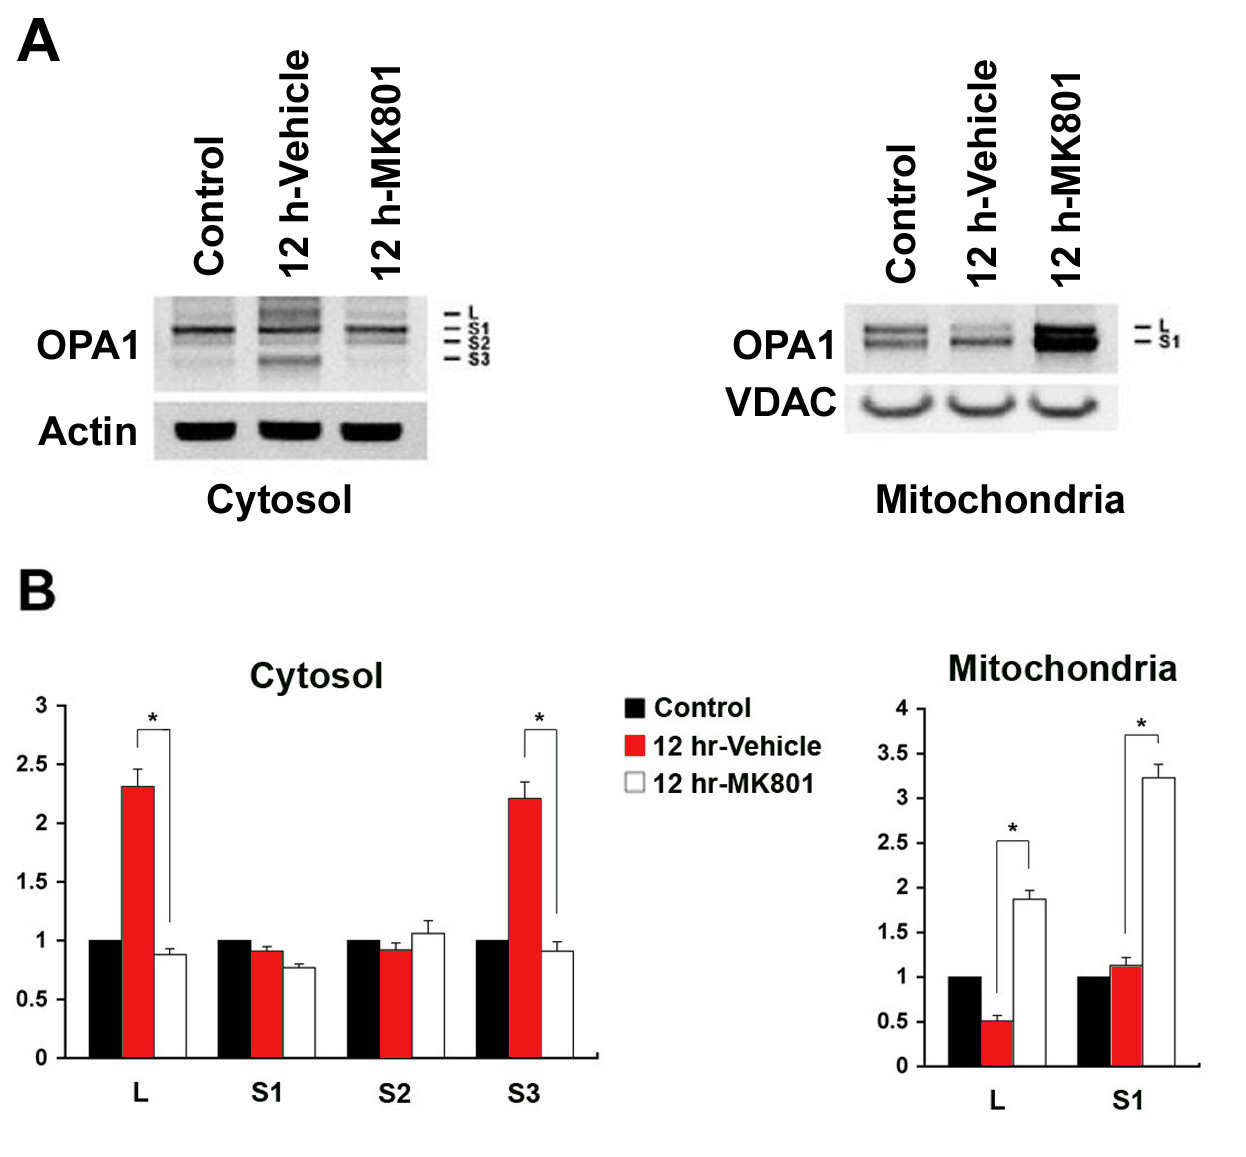
 Figure 4 of
Ju, Mol Vis 2008; 14:2629-2638.
Figure 4 of
Ju, Mol Vis 2008; 14:2629-2638.