Figure 3. The effect of MK801 in the normal rat retina. A: OPA1 gene expression was not changed in MK801-pretreated normal control retinas compared to non-treated normal control retinas.
B: The OPA1 protein bands observed at 80 and 90 kDa forms in cytosolic and mitochondrial fractions in both non-treated and MK801-treated
normal control retina. Relative intensity of chemiluminescence for each protein band was normalized using actin as cytosolic
fraction calibrator and VDAC as mitochondrial fraction calibrator. Note that there were no significant changes between non-treated
and MK801-treated normal control retina. Error bars represent the standard deviation.
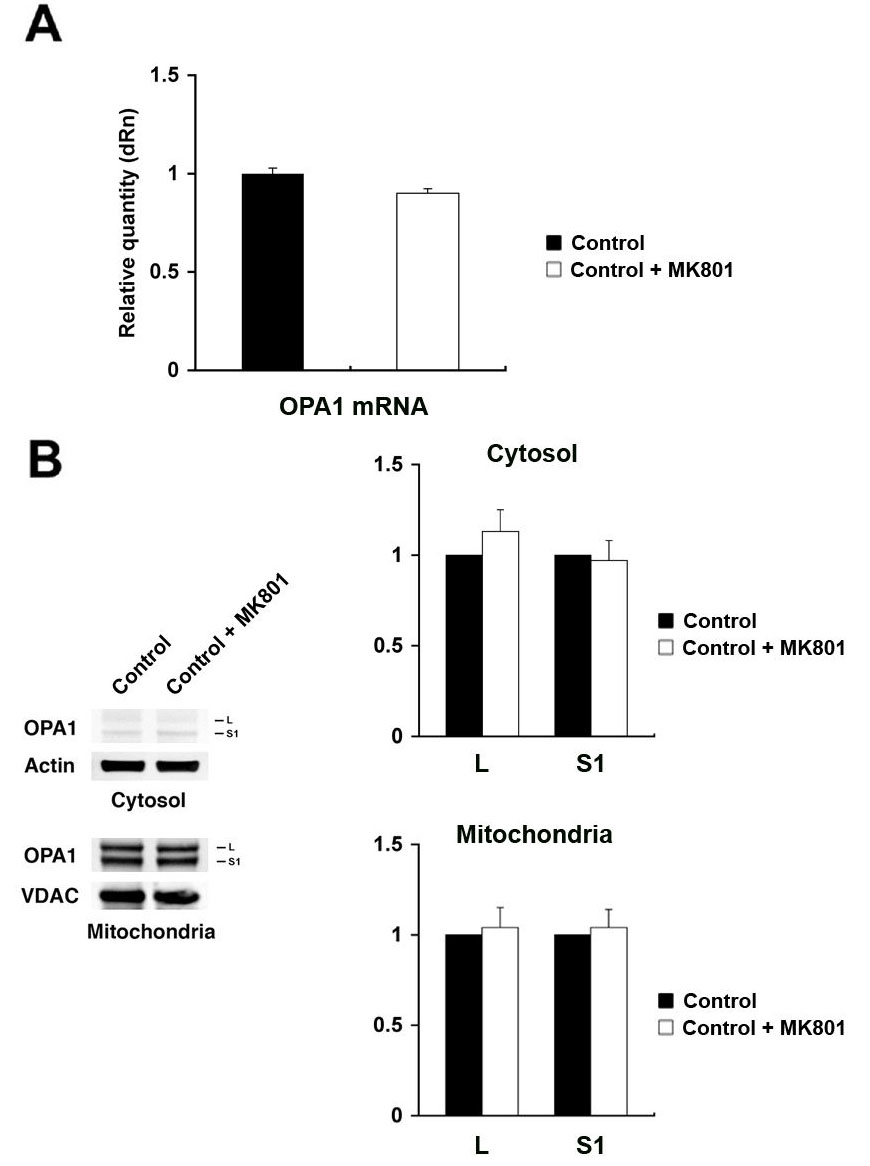
 Figure 3 of
Ju, Mol Vis 2008; 14:2629-2638.
Figure 3 of
Ju, Mol Vis 2008; 14:2629-2638.