Figure 2. Blockade of glutamate receptor activation increases OPA1 gene and protein expression in ischemic rat retina. A:OPA1 gene expression was not changed in vehicle-pretreated ischemic retinas but increased in MK801-pretreated ischemic retinas
at 12 h. B: The total isoformes of OPA1 protein bands (80–90 kDa) in the normal rat retina were increased after ischemia, and had a small
released fragment of OPA1 (~65 kDa:S3). Pretreatment with MK801 induced a larger increase of total L and S1 isoforms of OPA1
protein bands but decrease of total S3 isoform of OPA1 protein band. C: Relative intensity of chemiluminescence for each protein band was normalized using actin as cytosolic fraction calibrator.
Error bars represent the standard deviation (*p<0.05 by Student’s t-test, n=3). D-F: OPA1 immunoreactivity in normal retina (D), retina of vehicle pre-treated rats at 12 h after ischemia (E), and retina of MK801 pre-treated rats at 12 h after ischemia (F). Abbreviations: ONL represents outer nuclear layer; OPL represents outer plexiform layer; INL represents inner nuclear layer;
IPL represents inner plexiform layer; GCL represents ganglion cell layer. The scale bar represents 20 μm (D-F).
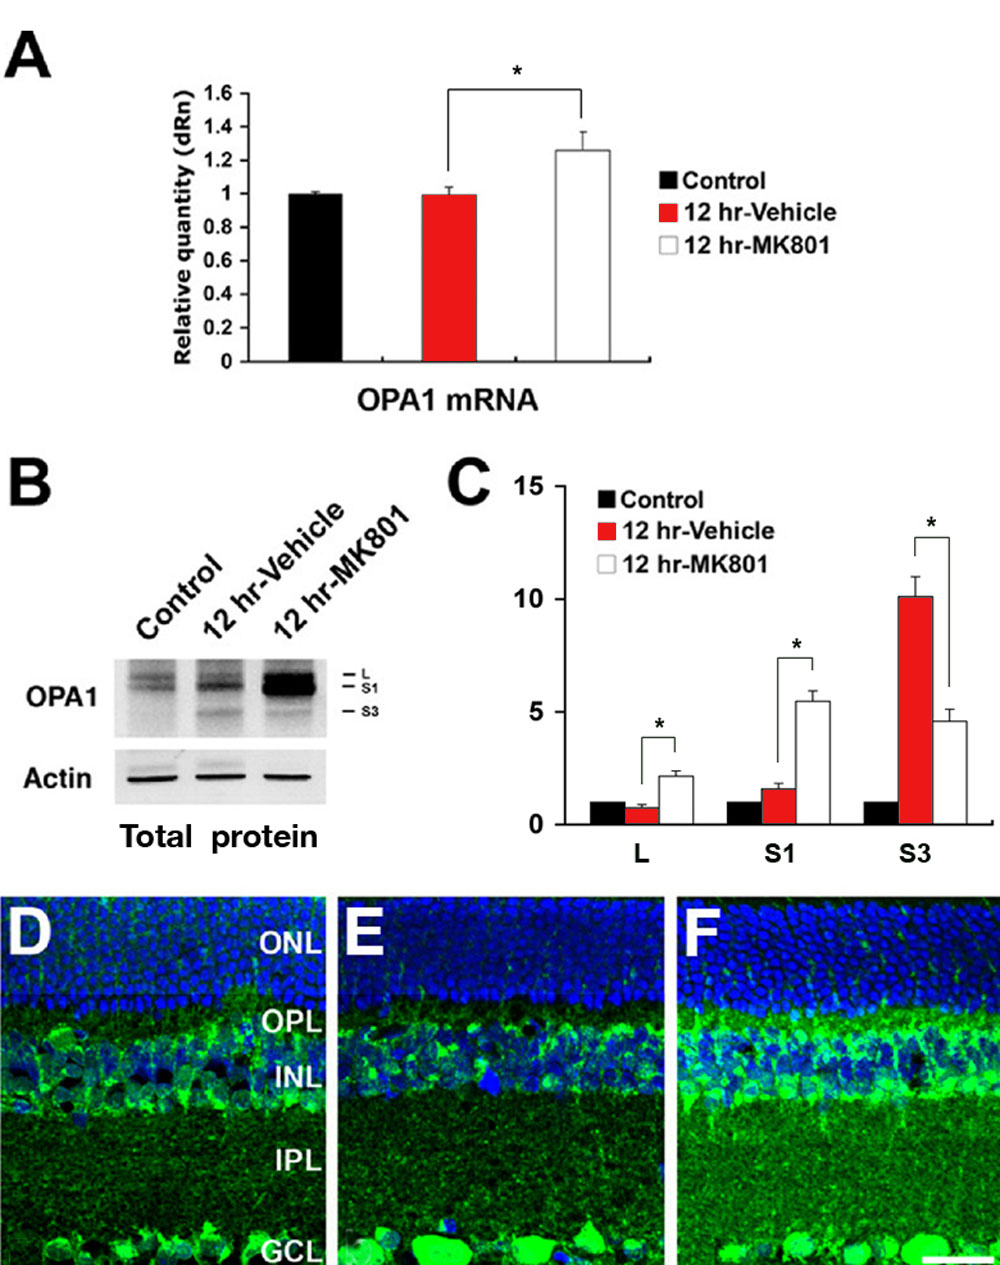
 Figure 2 of
Ju, Mol Vis 2008; 14:2629-2638.
Figure 2 of
Ju, Mol Vis 2008; 14:2629-2638.