Figure 9. The inhibition effect of blocking NF-κB pathway on the proliferation of HTFs through RNAi. Data are presented as the percentage
of viable cells compared with the untreated (control) cells (mean ± SD, n=6). An asterisk indicates that p<0.05.
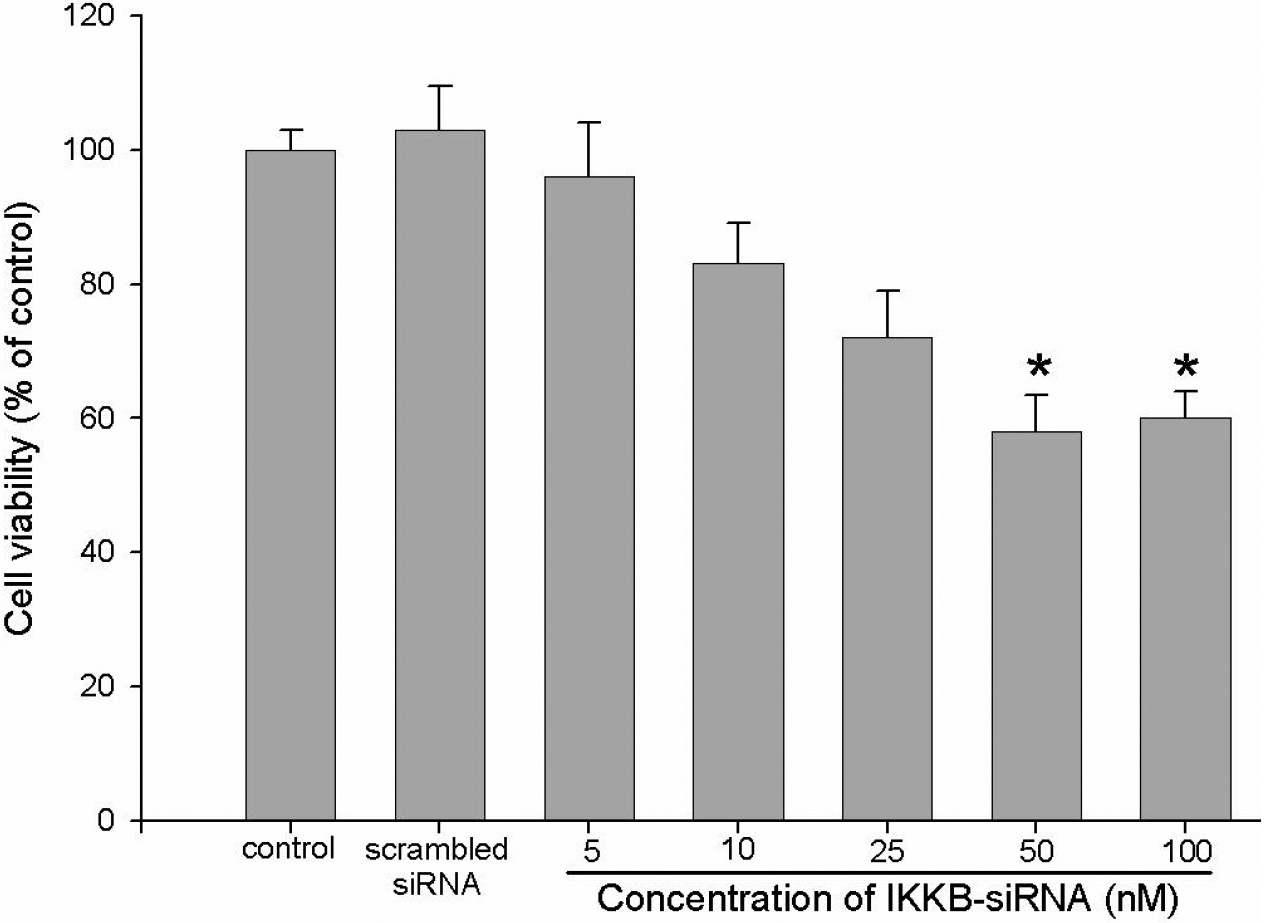
 Figure 9 of
Duan, Mol Vis 2008; 14:2616-2628.
Figure 9 of
Duan, Mol Vis 2008; 14:2616-2628.