Figure 6. The transfection efficiency of CS-g-(PEI-b-mPEG) and 25 kDa PEI at different N/P ratios in HeLa cells and HTFs. Data are presented as the percentage of HeLa cells or
HTFs containing FITC-conjuncted siRNA, respectively, and data of 25 kDa PEI/siRNA complexes at N/P ratio of 20 can’t be measured
(not available, NA). A: transfection efficiency in HeLa cells (mean±SD, n=3); B: transfection efficiency in HTFs (mean±SD, n=3).
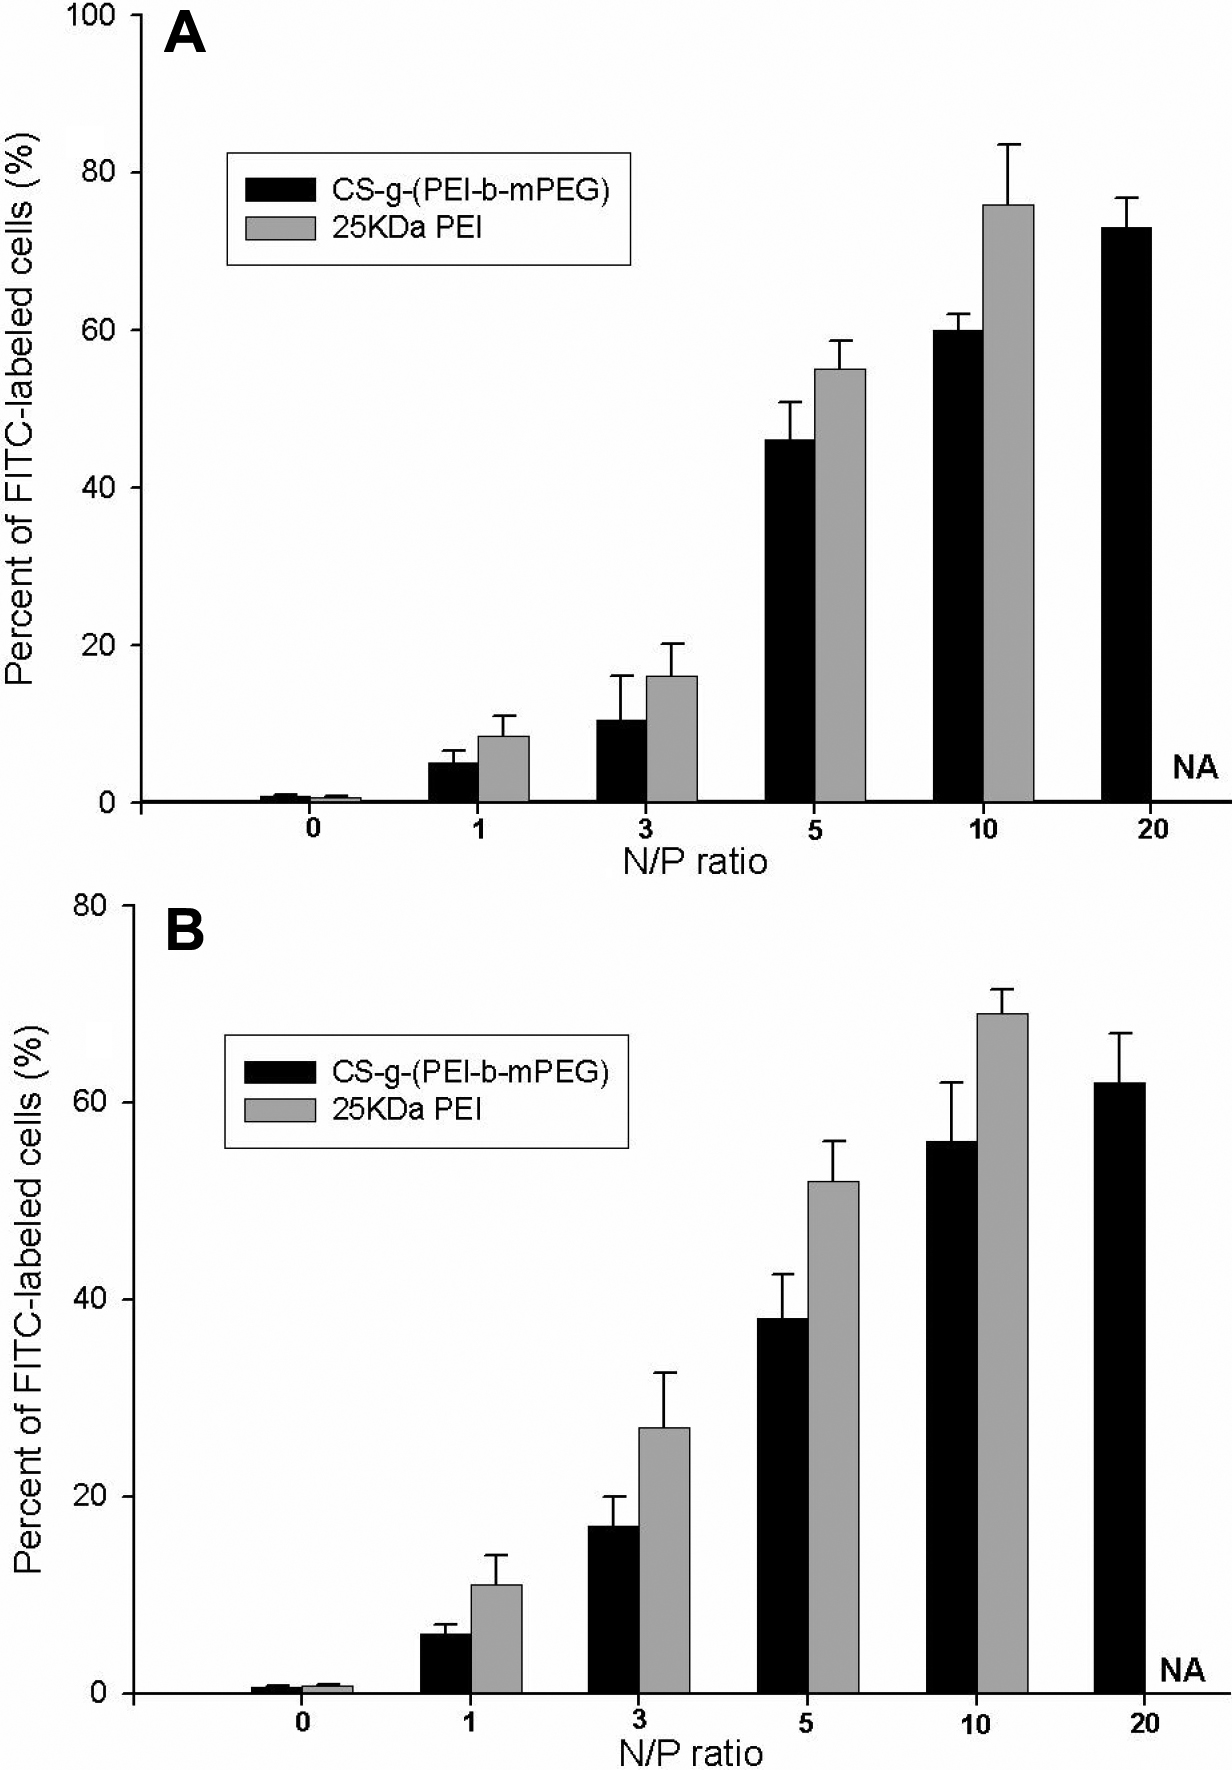
 Figure 6 of
Duan, Mol Vis 2008; 14:2616-2628.
Figure 6 of
Duan, Mol Vis 2008; 14:2616-2628.