Figure 2 of
Duan, Mol Vis 2008; 14:2616-2628.
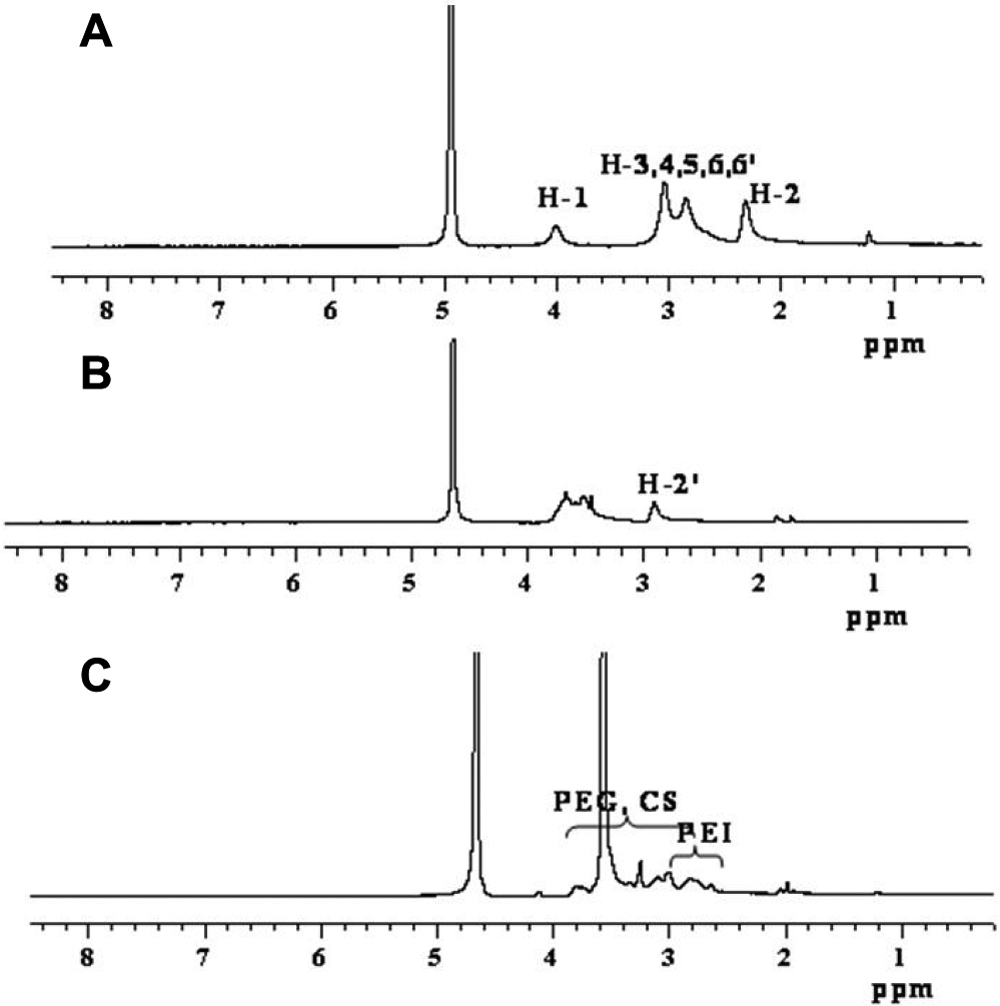
Figure 2.
The
1
H NMR spectra of CS and its derivatives. Spectra were obtained with 32 scans, and delay of 2 s between pulses.
A
: CS in D
2
O and CF3COOD at 293 K,
B
: CS-CHO in D
2
O at 293 K;
C
: CS-g-(PEI-b-mPEG) in D
2
O at 293 K.
 Figure 2 of
Duan, Mol Vis 2008; 14:2616-2628.
Figure 2 of
Duan, Mol Vis 2008; 14:2616-2628.