Figure 12. mPins mRNA and protein
levels in the mouse lens during postnatal development and adulthood. A
shows semiquantitative RT–PCR results for determination of the relative
amounts of mPins mRNA in the lens at P0, P14, P16, and 2 months
after birth (2 M) and their comparison with the relative amounts in the
retina and whole eye at 2M. The 473 bp and 311 bp bands correspond to
the mPins and cyclophilin PCR products, respectively.
The relative levels of mPins mRNA are also calculated as a
ratio of the intensity of the mPins band to that of the cyclophilin
band. The densitometric analysis of PCR band intensities shows low
levels of mPins mRNA in the lens at the P0 stage. These levels
increase significantly at P14 and are maintained until adulthood. They
are similar to those in the adult retina and whole eye. B shows
a western blot used to determine the relative levels of mPins protein
in the lens at P0, P14, P16, and 2M; these levels were compared with
those in the retina and whole eye at 2M. Specific bands for mPins
(75.6 kDa) and β-actin (35 kDa) are detected in the lens,
whole eye, and neuroretina extracts. The mPins protein is not detected
in the lens at the P0 stage. However, it is detected at the P14 stage,
and the levels are maintained from this stage to adulthood. Retina and
whole eye at 2M are used as positive controls. The western blot images
in Panel B are indeed cropped. The lanes are of course unambiguously
otherwise free of signal.
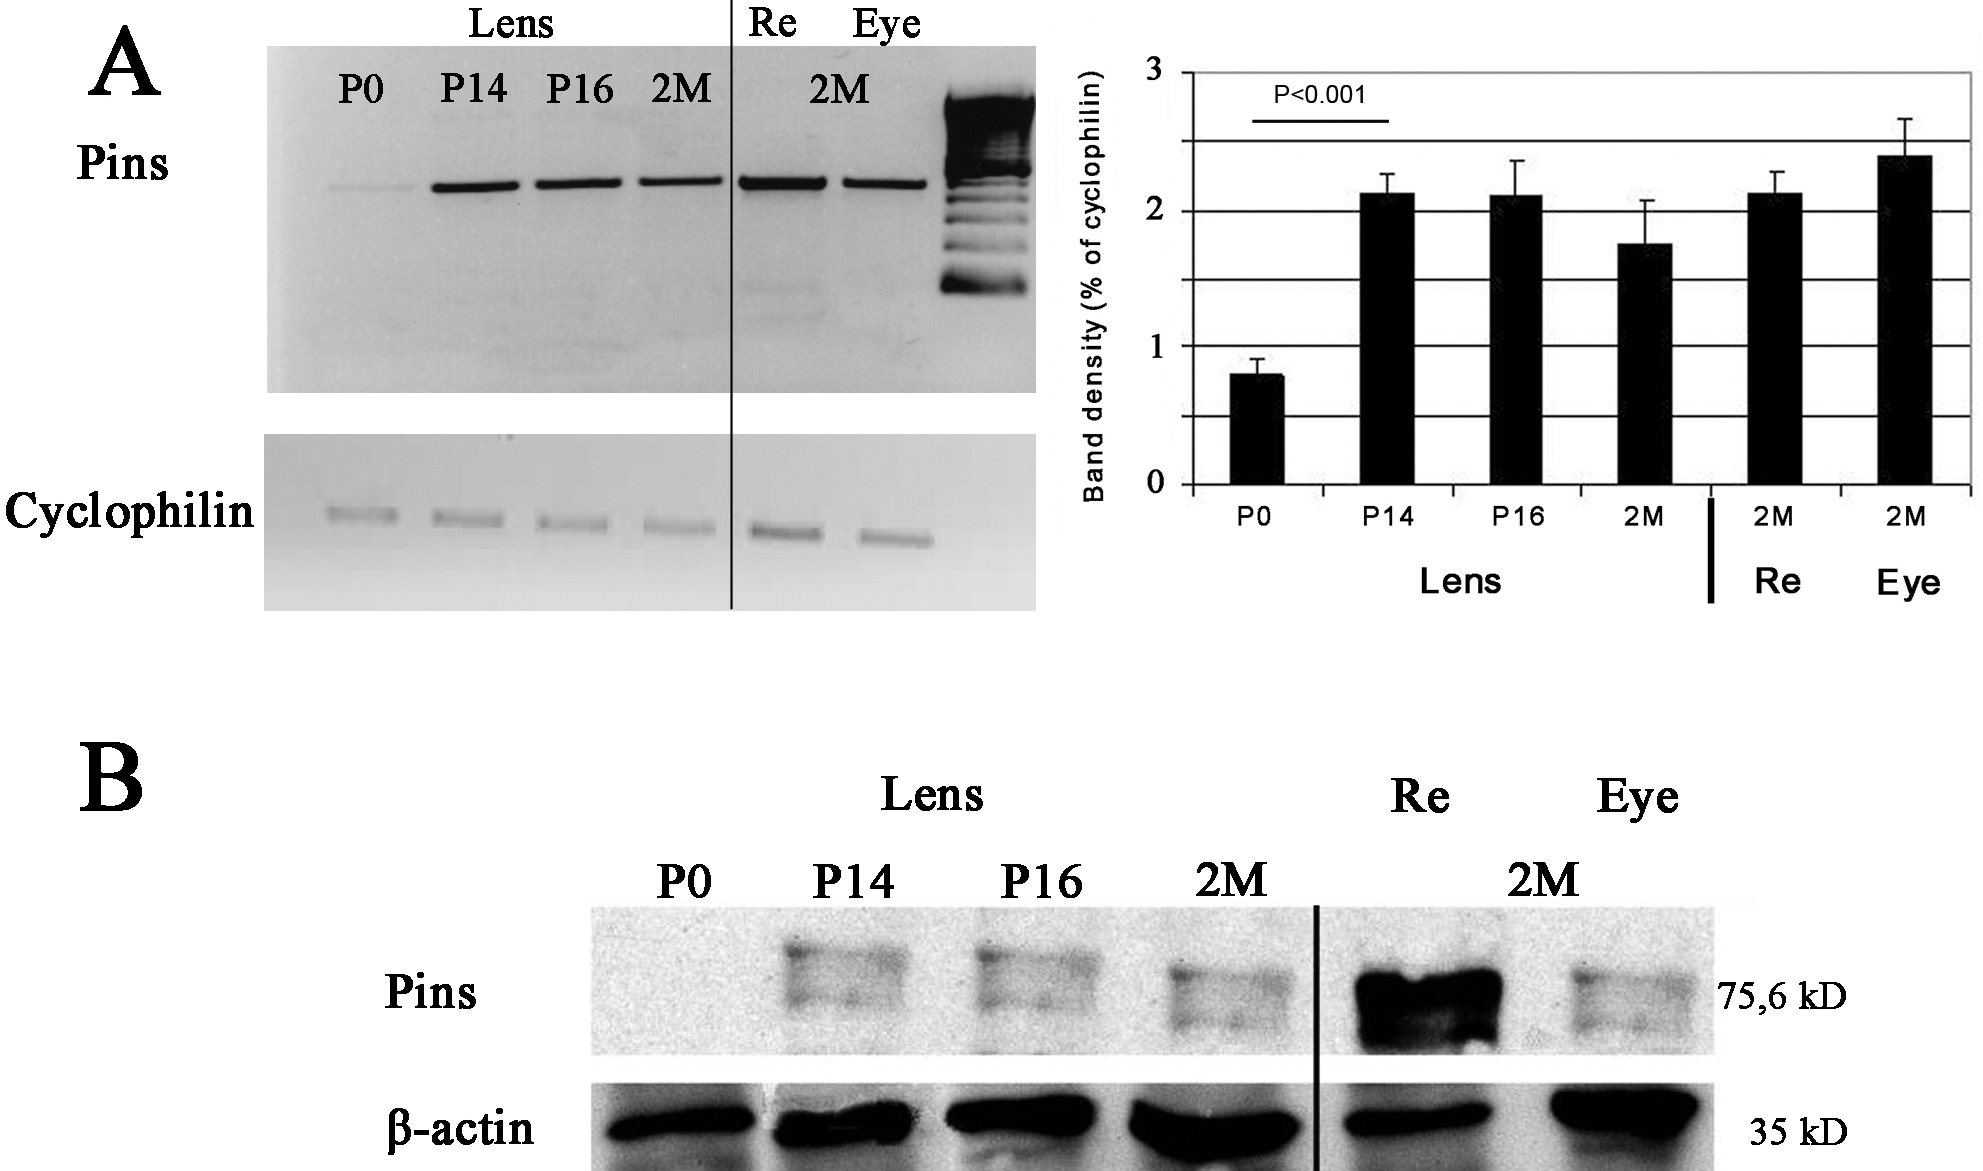
 Figure 12 of Raji, Mol Vis 2008; 14:2575-2596.