Figure 11. Colocalization of mPins and
Numb proteins in undifferentiated mouse retina. A shows
double-labeling of mouse retina at stage P3 with antibodies against
mPins and Numb proteins. The first and second panels from the left
correspond to labeling for mPins (red) and Numb (green), respectively.
The third panel represents the merged image. The fourth panel shows the
colocalization area between mPins and Numb (white). B shows a
scatter plot of red versus green intensities generated by Imaris
software. The percentage of material colocalized and the Pearson
coefficient are indicated below the graph. At P3, the 2 antibodies gave
almost identical staining patterns, and colocalization (fourth panel,
white) seemed to be more intense in the ganglion cell layer (GCL), the
inner part of the neuroblastic layer (Nbl), and the retinal pigment
epithelium (RPE; A). The colocalization quantification value
supports our observations. We obtained a large percentage of material
colocalized (about 40%) and a high Pearson coefficient for colocalized
voxels (0.73; B).
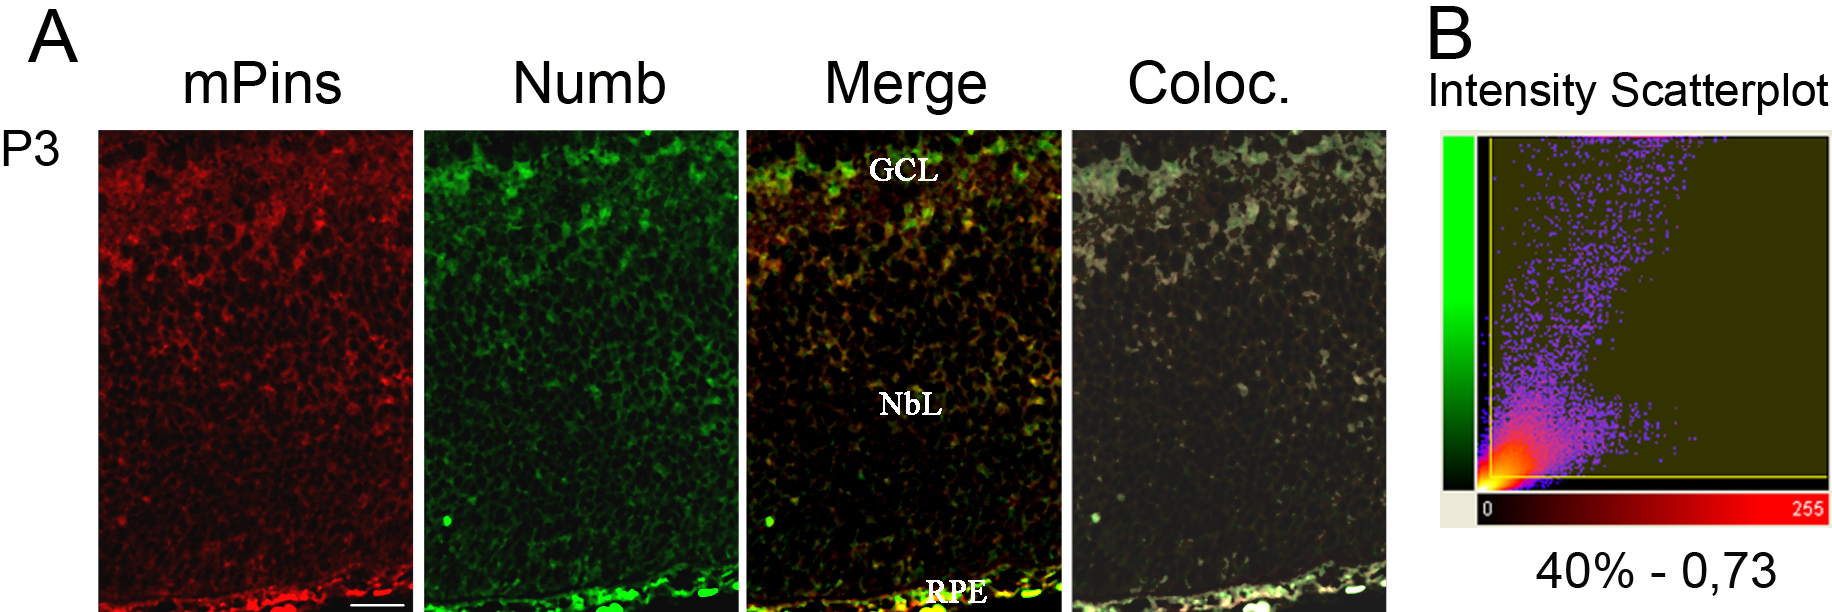
 Figure 11 of Raji, Mol Vis 2008; 14:2575-2596.