Figure 1. mPins mRNA levels in mouse eye during development and adulthood. A and C show semiquantitative RT–PCR determinations of the relative amounts of mPins mRNA in mouse whole eye at P0, P8, P15, P21, and P60 (A); and in neuroretina (Re), in the retinal pigment epithelium (RPE), and in the ciliary body (CB) of adult mouse (C). The cyclophilin mRNA was used as an internal control. The 473 and 311 bp bands correspond to the RT–PCR products for mPins and cyclophilin, respectively. B and D show densitometric analysis of the intensity of the PCR bands corresponding to A and C, respectively. The RNA blot images are cropped very tight. However the lanes were otherwise indeed free of signal and the
results of densitrometric analysis were not affected by the cropping. The relative levels are calculated as the ratio of intensity
of the mPins band to that of the cyclophilin band. The intensity of the mPins band does not seem to change during postnatal eye development, with the exception of the lower intensity of the mPins band at P15 (p<0.001; A and B). mPins mRNA levels are higher in the retina than in the RPE and CB (n=5; C and D). Error bars indicate the SEM.
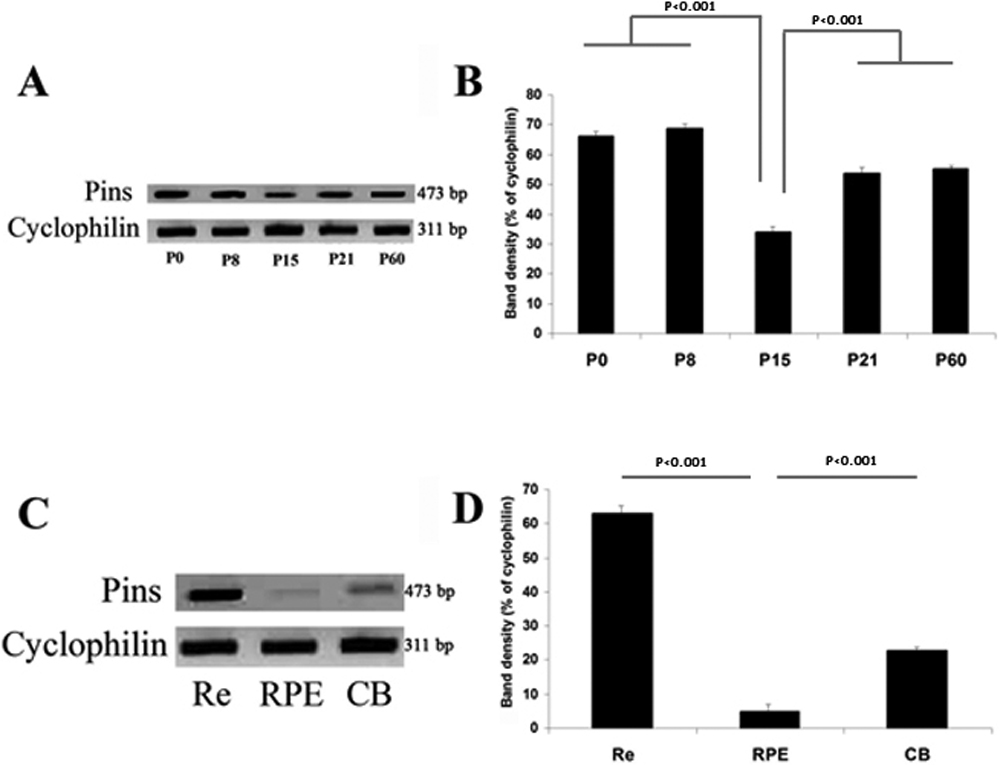
 Figure 1 of
Raji, Mol Vis 2008; 14:2575-2596.
Figure 1 of
Raji, Mol Vis 2008; 14:2575-2596.