Figure 7. Effects of TSA on wound healing migration of corneal fibroblasts. The wounds were introduced by scraping the cell layers with
a pipette tip. A: Representative photographs of migrated cells that received either control treatment or different concentrations of TSA.
B: The number of cells migrated between the injury lines were counted and compared. Migration rate was determined as follows:
migration rate=(cell number of TSA group between the injury lines/cell number of control group between the injury lines) x100%.
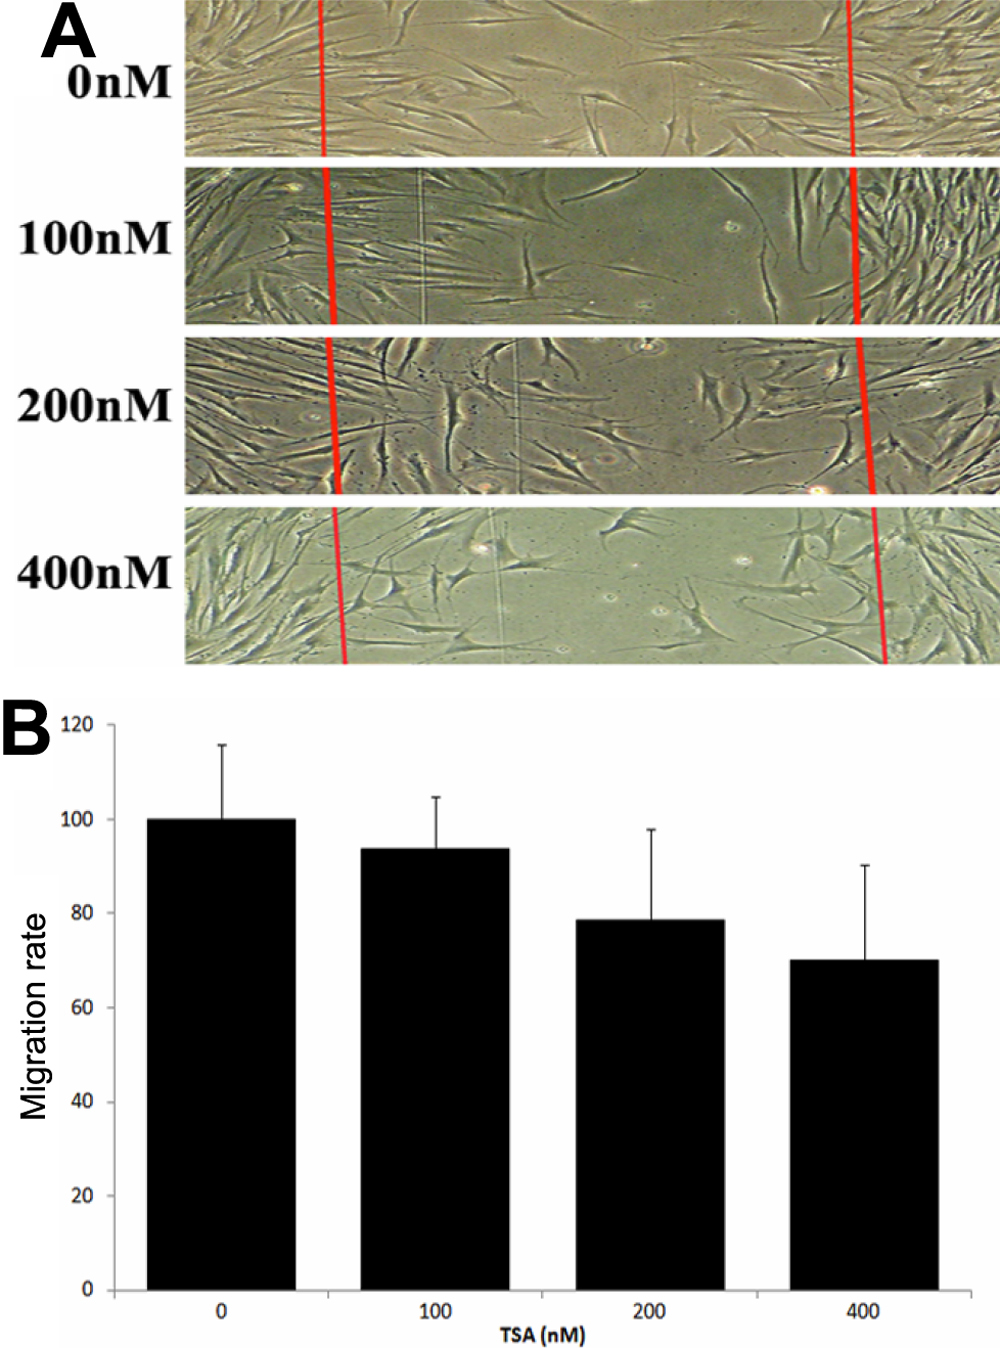
 Figure 7 of
Zhou, Mol Vis 2008; 14:2556-2565.
Figure 7 of
Zhou, Mol Vis 2008; 14:2556-2565.