Figure 6. Cell cycle distribution of corneal fibroblasts treated with TSA or NaBu. In normal human corneal fibroblasts, about 64.4%,
6.5% and 29.1% were in the G0/G1, G2/M, and S phase, respectively. After treatment with 400 nM TSA or 5 mM NaBu for 3 days, the proportion of cells in the G0/G1 phase increased to 80.9% with TSA and to 78.5% with NaBu, the proportion of cells in the G2/M phase increased to 10.4% with TSA and 9.4% with NaBu, and the proportion of cells in the S phase reduced to 8.7% with TSA
and 12.1% with NaBu.
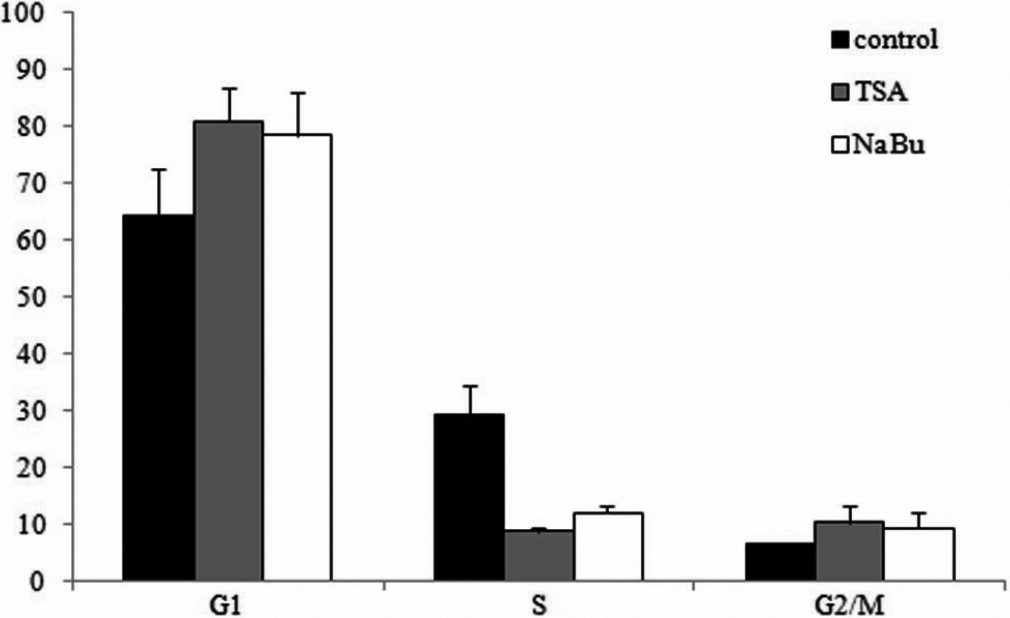
 Figure 6 of
Zhou, Mol Vis 2008; 14:2556-2565.
Figure 6 of
Zhou, Mol Vis 2008; 14:2556-2565.