Figure 1. Western blot and regression analysis for soluble MUC16 quantification. A: An example of a soluble MUC16 western blot from tear samples derived from 17 subjects. Lanes 1–7 are MUC16 standard antigen
(CA125) Units (based on radio-immunoassay calibration from the vendor); (Lane 1=60, Lane 2=40, Lane 3=20, Lane 4=10, Lane
5=5, Lane 6=3, Lane 7=1 U); Lanes 8 - 24 are tear samples. B: A regression curve was created by graphing applied concentration of CA125 standard against the optical density of the resulting
band immunoreactivity. Total MUC16 concentration was quantified by extrapolation from this curve using all signal above 300 kDa.
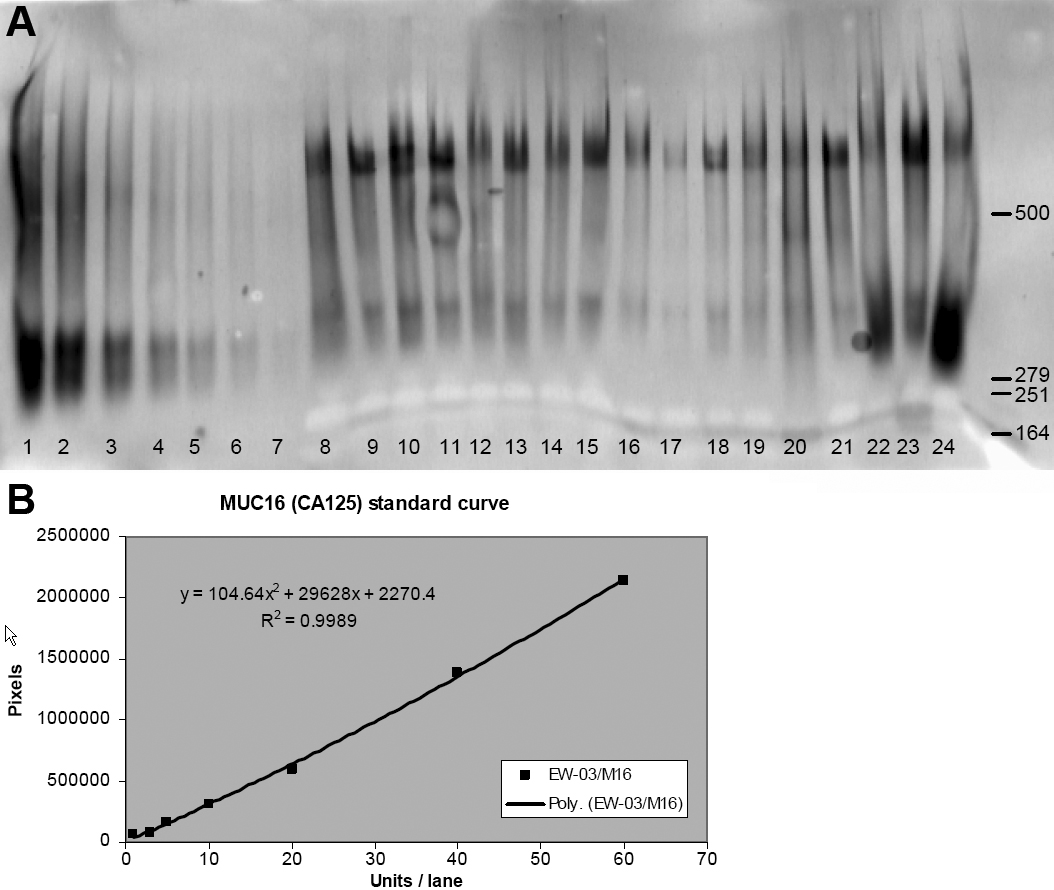
 Figure 1 of
Caffery, Mol Vis 2008; 14:2547-2555.
Figure 1 of
Caffery, Mol Vis 2008; 14:2547-2555.