Figure 6. PEDF expression profile
following 1 IVT injection of Ad5 or Ad35-based vectors. PEDF levels in
mouse eyes following a single IVT injection of 1×10⁹ pu of
Ad5.PEDF or Ad35.PEDF (HI-RGD). Naive animals served as negative
controls. On Days 1, 28, and 60 post vector injection, eyes were
harvested and PEDF levels quantitated by ELISA developed by GenVec,
Inc. Data are expressed as the mean±SEM (error bars) with an n=15
mice/treatment group/time point, except for Day 60 which has an n=5
mice/treatment group. The asterisk points to a statistically
significant difference between the Ad5 and Ad35 groups on Day 28 and 60
post injection (p<0.05, two-tailed Student’s t-test).
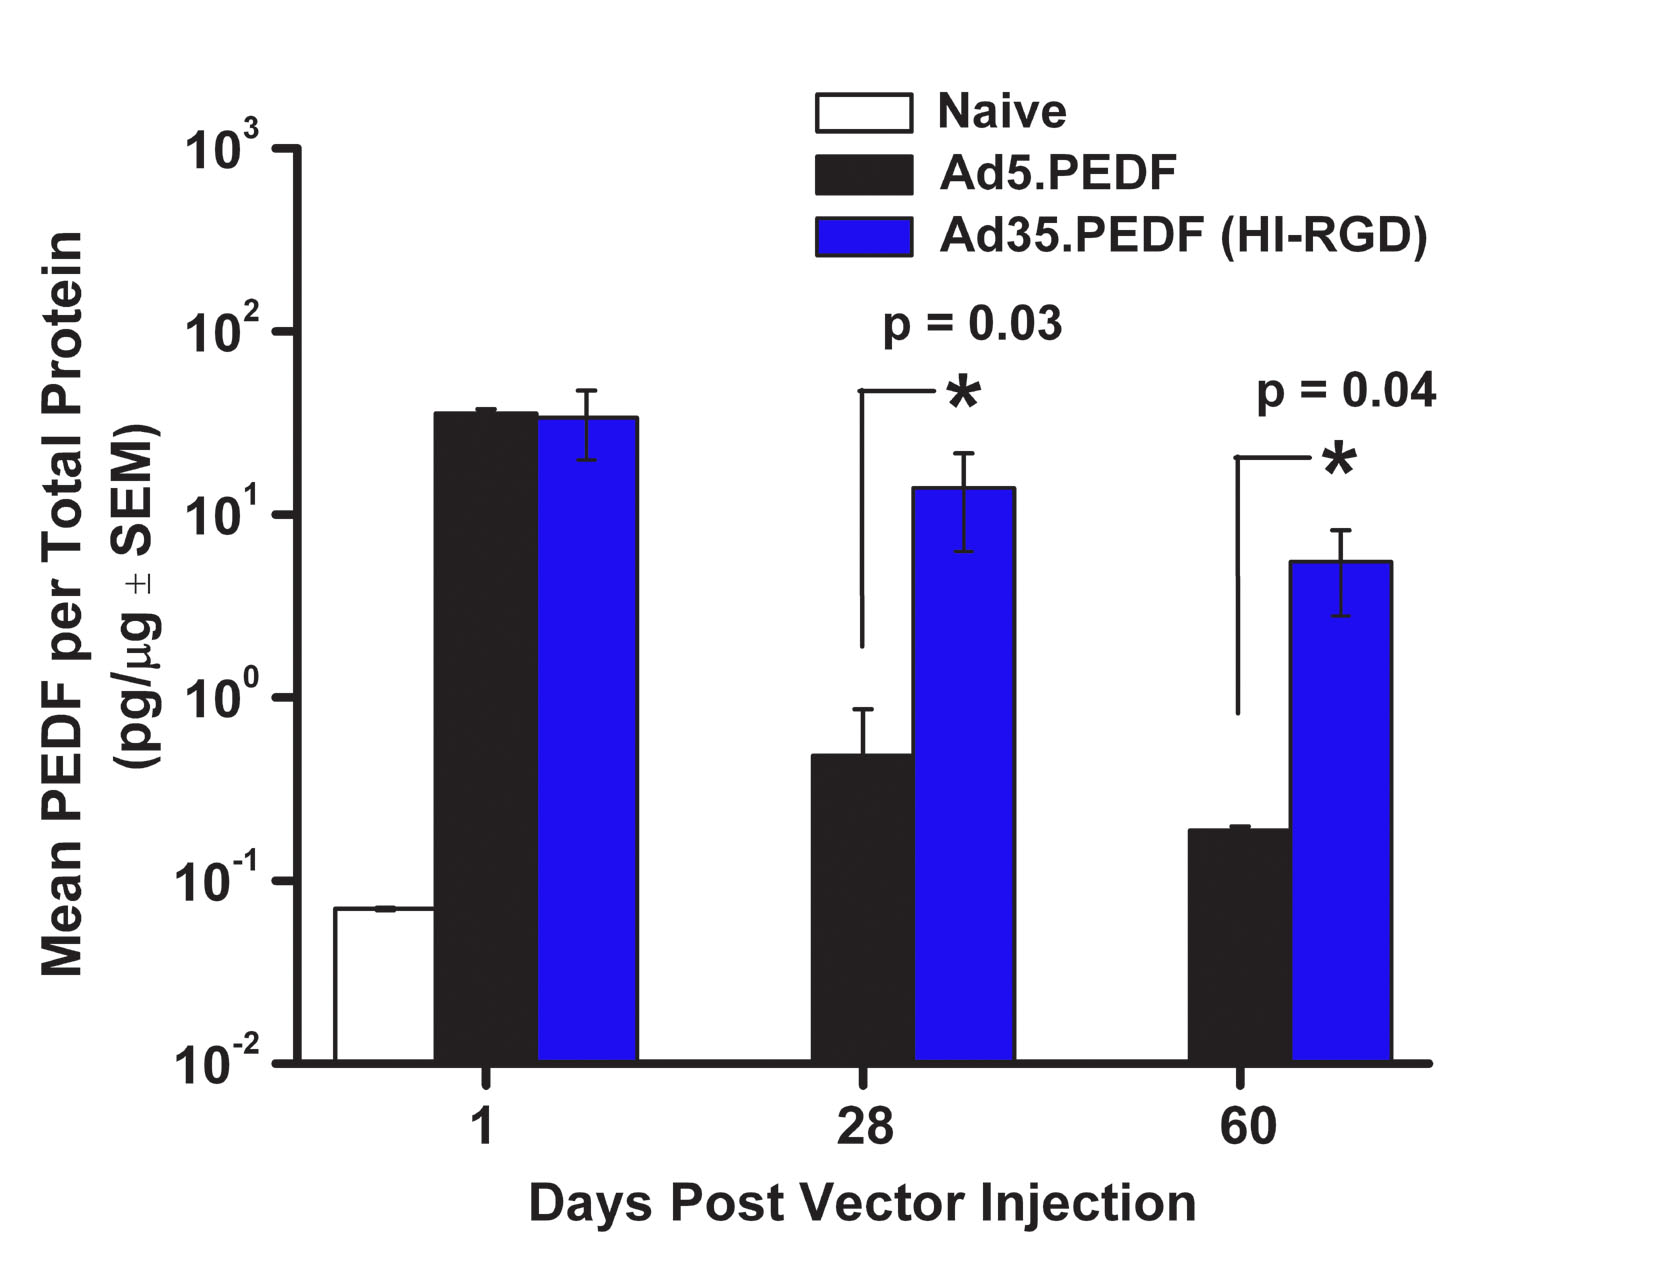
 Figure 6 of Hamilton, Mol Vis 2008; 14:2535-2546.