Figure 5. Luciferase expression profile
following 1 IVT injection of Ad5- or Ad35-based vectors. Luciferase
activity in mouse eyes following a single IVT injection of 1×10⁹
pu of either Ad5.L or Ad35.L (HI-RGD). Naive animals served as negative
controls. On Days 1, 28, 60, and 120 post vector injection, eyes were
harvested and luciferase activity assessed. Data are expressed as the
mean±SEM (error bars) with an n=15 mice/treatment group/time point,
except for Day 120, which has an n=5 mice/treatment group. The asterisk
indicates a statistically significant difference between the Ad5 and
Ad35 groups on Day 120 post injection (p<0.05, two-tailed Student’s t-test).
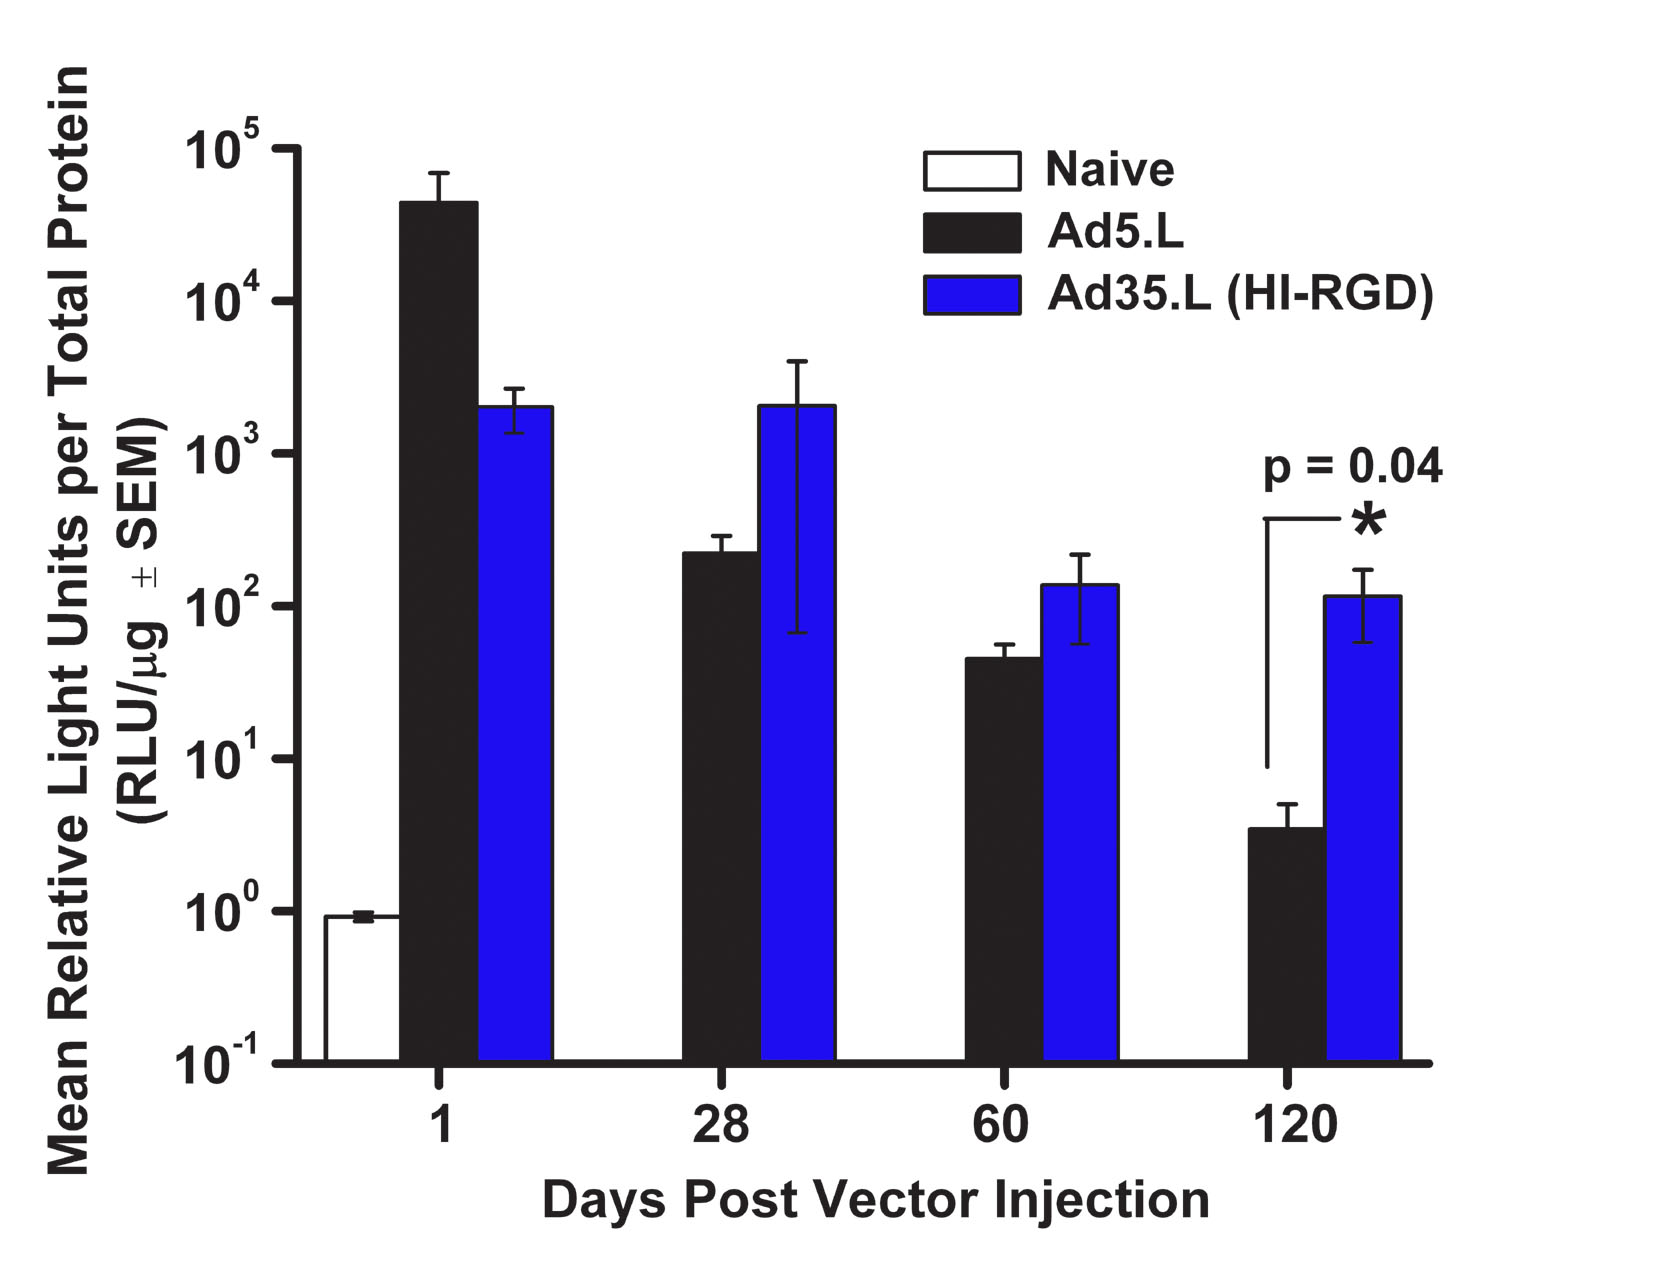
 Figure 5 of Hamilton, Mol Vis 2008; 14:2535-2546.