Figure 4. Effect of EGCG on intracellular H2O2 production of ARPE19 cells after UVA radiation exposure. ARPE19 cells pretreated with PBS (A,B) or EGCG for 2 h (C-E) were loaded with DHR 123. After being exposed to 20 J/cm2 UVA radiation (B-E), cells were collected and subjected to flow cytometric analysis. Results are presented as histograms of the number of cells
versus fluorescence intensity. Each histogram represents three independent experiments. F: Quantitative analyses of intracellular H2O2 in ARPE19 cells (n=3). The asterisk indicates p<0.05 versus UVA-exposed cells without EGCG pretreatment.
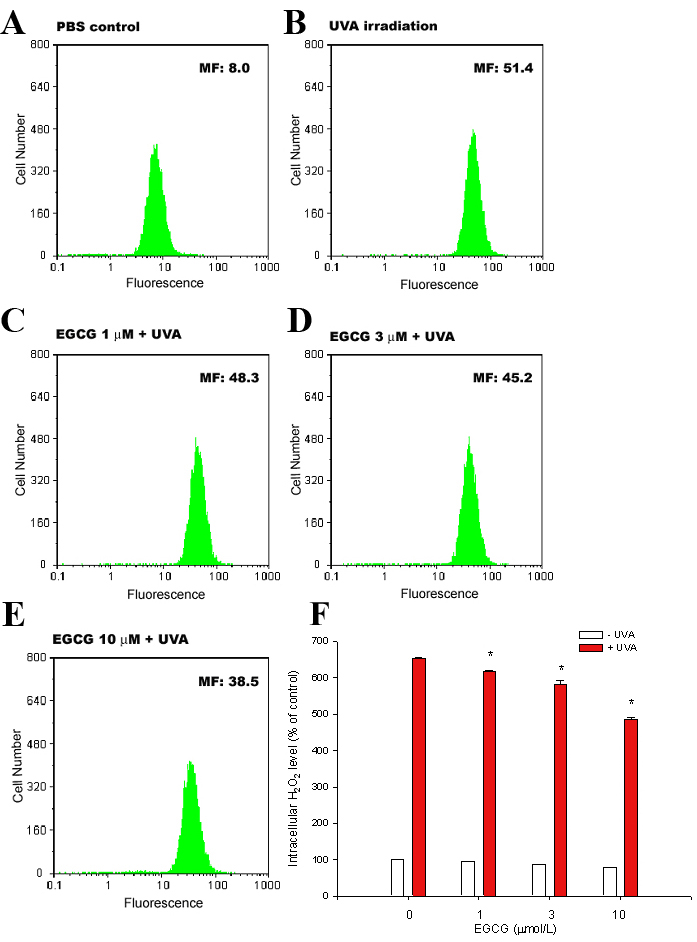
 Figure 4 of
Chan, Mol Vis 2008; 14:2528-2534.
Figure 4 of
Chan, Mol Vis 2008; 14:2528-2534.