Figure 3. Cone density maps with
correlation to predicted area centralis. Nine eyes from 5 animals were
examined. A shows all 9 retinas used in analysis, demonstrating
a marked visual streak of high cone density with an area centralis
temporal to the optic nerve head. Data sets were reflected as necessary
to represent all eyes as right. Orientation is depicted: nasal (N),
temporal (T), superior (S), and inferior (I). B shows the
average calculation from all 9 retinas demonstrating the mean density
in the visual streak and a predictable location of the area centralis
0.4 optic nerve head (ONH) diameters superior and 1.1 ONH diameters
temporal to the optic disc.
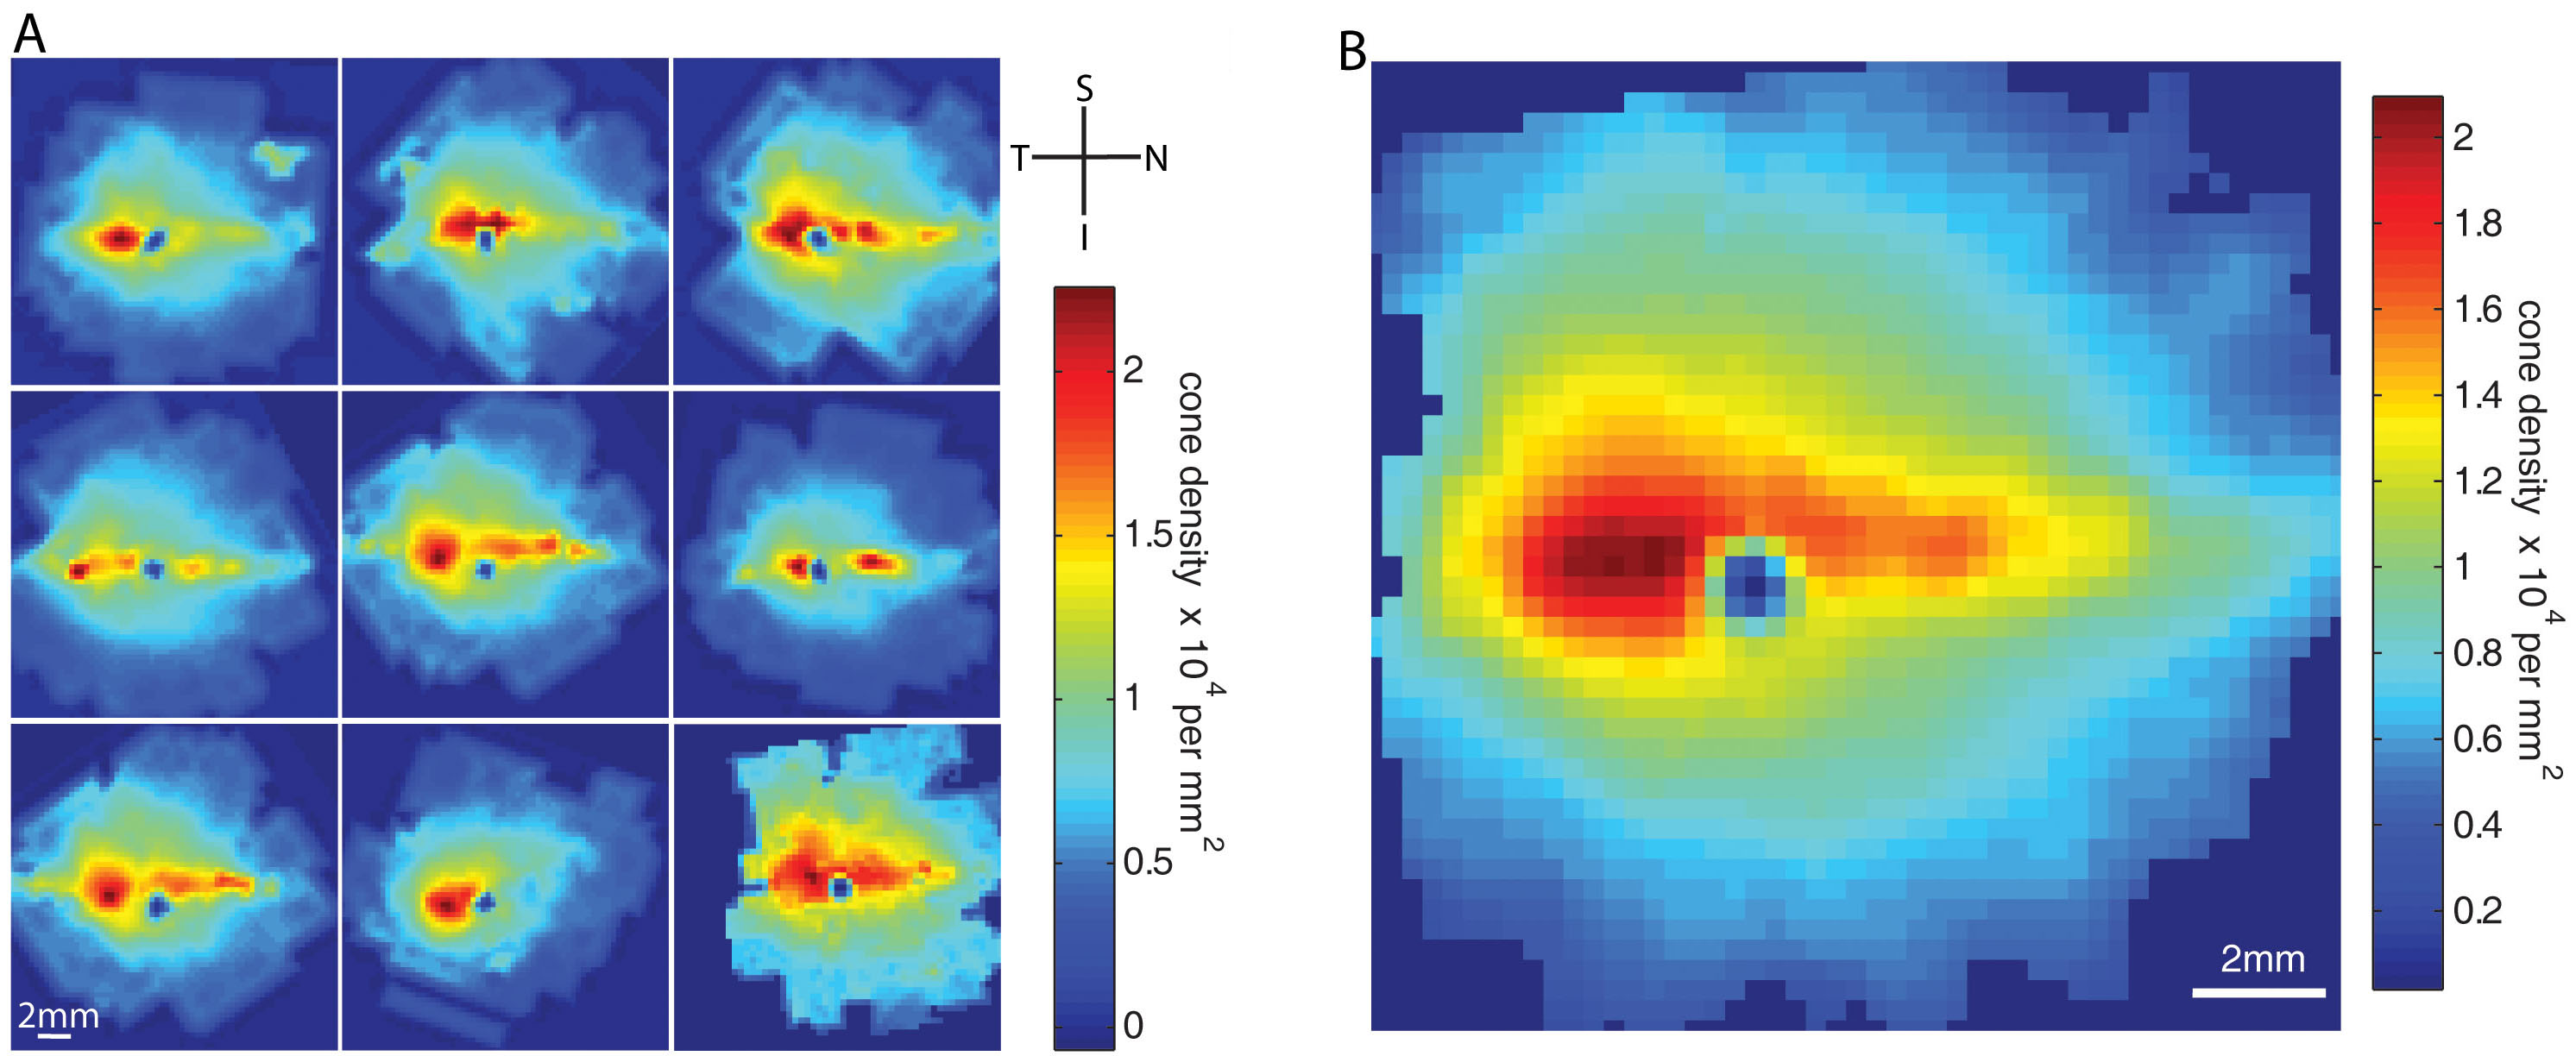
 Figure 3 of Mowat, Mol Vis 2008; 14:2518-2527.