Figure 2. Comparison of opsin subtype
distribution in the beagle retina. Nine eyes from 5 animals were
examined. A-C: retinal flatmounts stained with peanut
agglutinin (PNA; blue) and either long wavelength (L/M) or short
wavelength (S) cone opsin (red) were analyzed. Representative images
are shown in A. Absolute L/M cone density was significantly
higher in the area centralis (B; p=0.0225), there was no
difference in S cone density between the 2 areas examined (B;
p=0.49). Quantification of L/M and S cones as a percentage of total
cone number showed no statistical difference between the two areas
examined (C; S cones p=0.16, L/M cones p=0.12). D-E:
Serial 10 μm retinal cryosections were stained with PNA (green) and
either L/M or S opsin (red) in a similar manner. Representative images
are shown in D. The following areas in cross section are
identified in D: outer nuclear layer (ONL), inner/outer
segments (OS), retinal pigment epithelium (RPE), tapetum lucidum (TL)
Nuclei are identified with Hoechst 33342 in blue. Analysis of
cryosections for L/M and S cone percentage in the two areas examined
showed no significant difference, supporting the flatmount data (E;
S cones p=0.18, L/M cones p=0.11). Using an unpaired t-test,
significant values are marked with asterisks **** p<0.0001, *
p<0.05. In all graphs, the inferior periphery bars are marked in red.
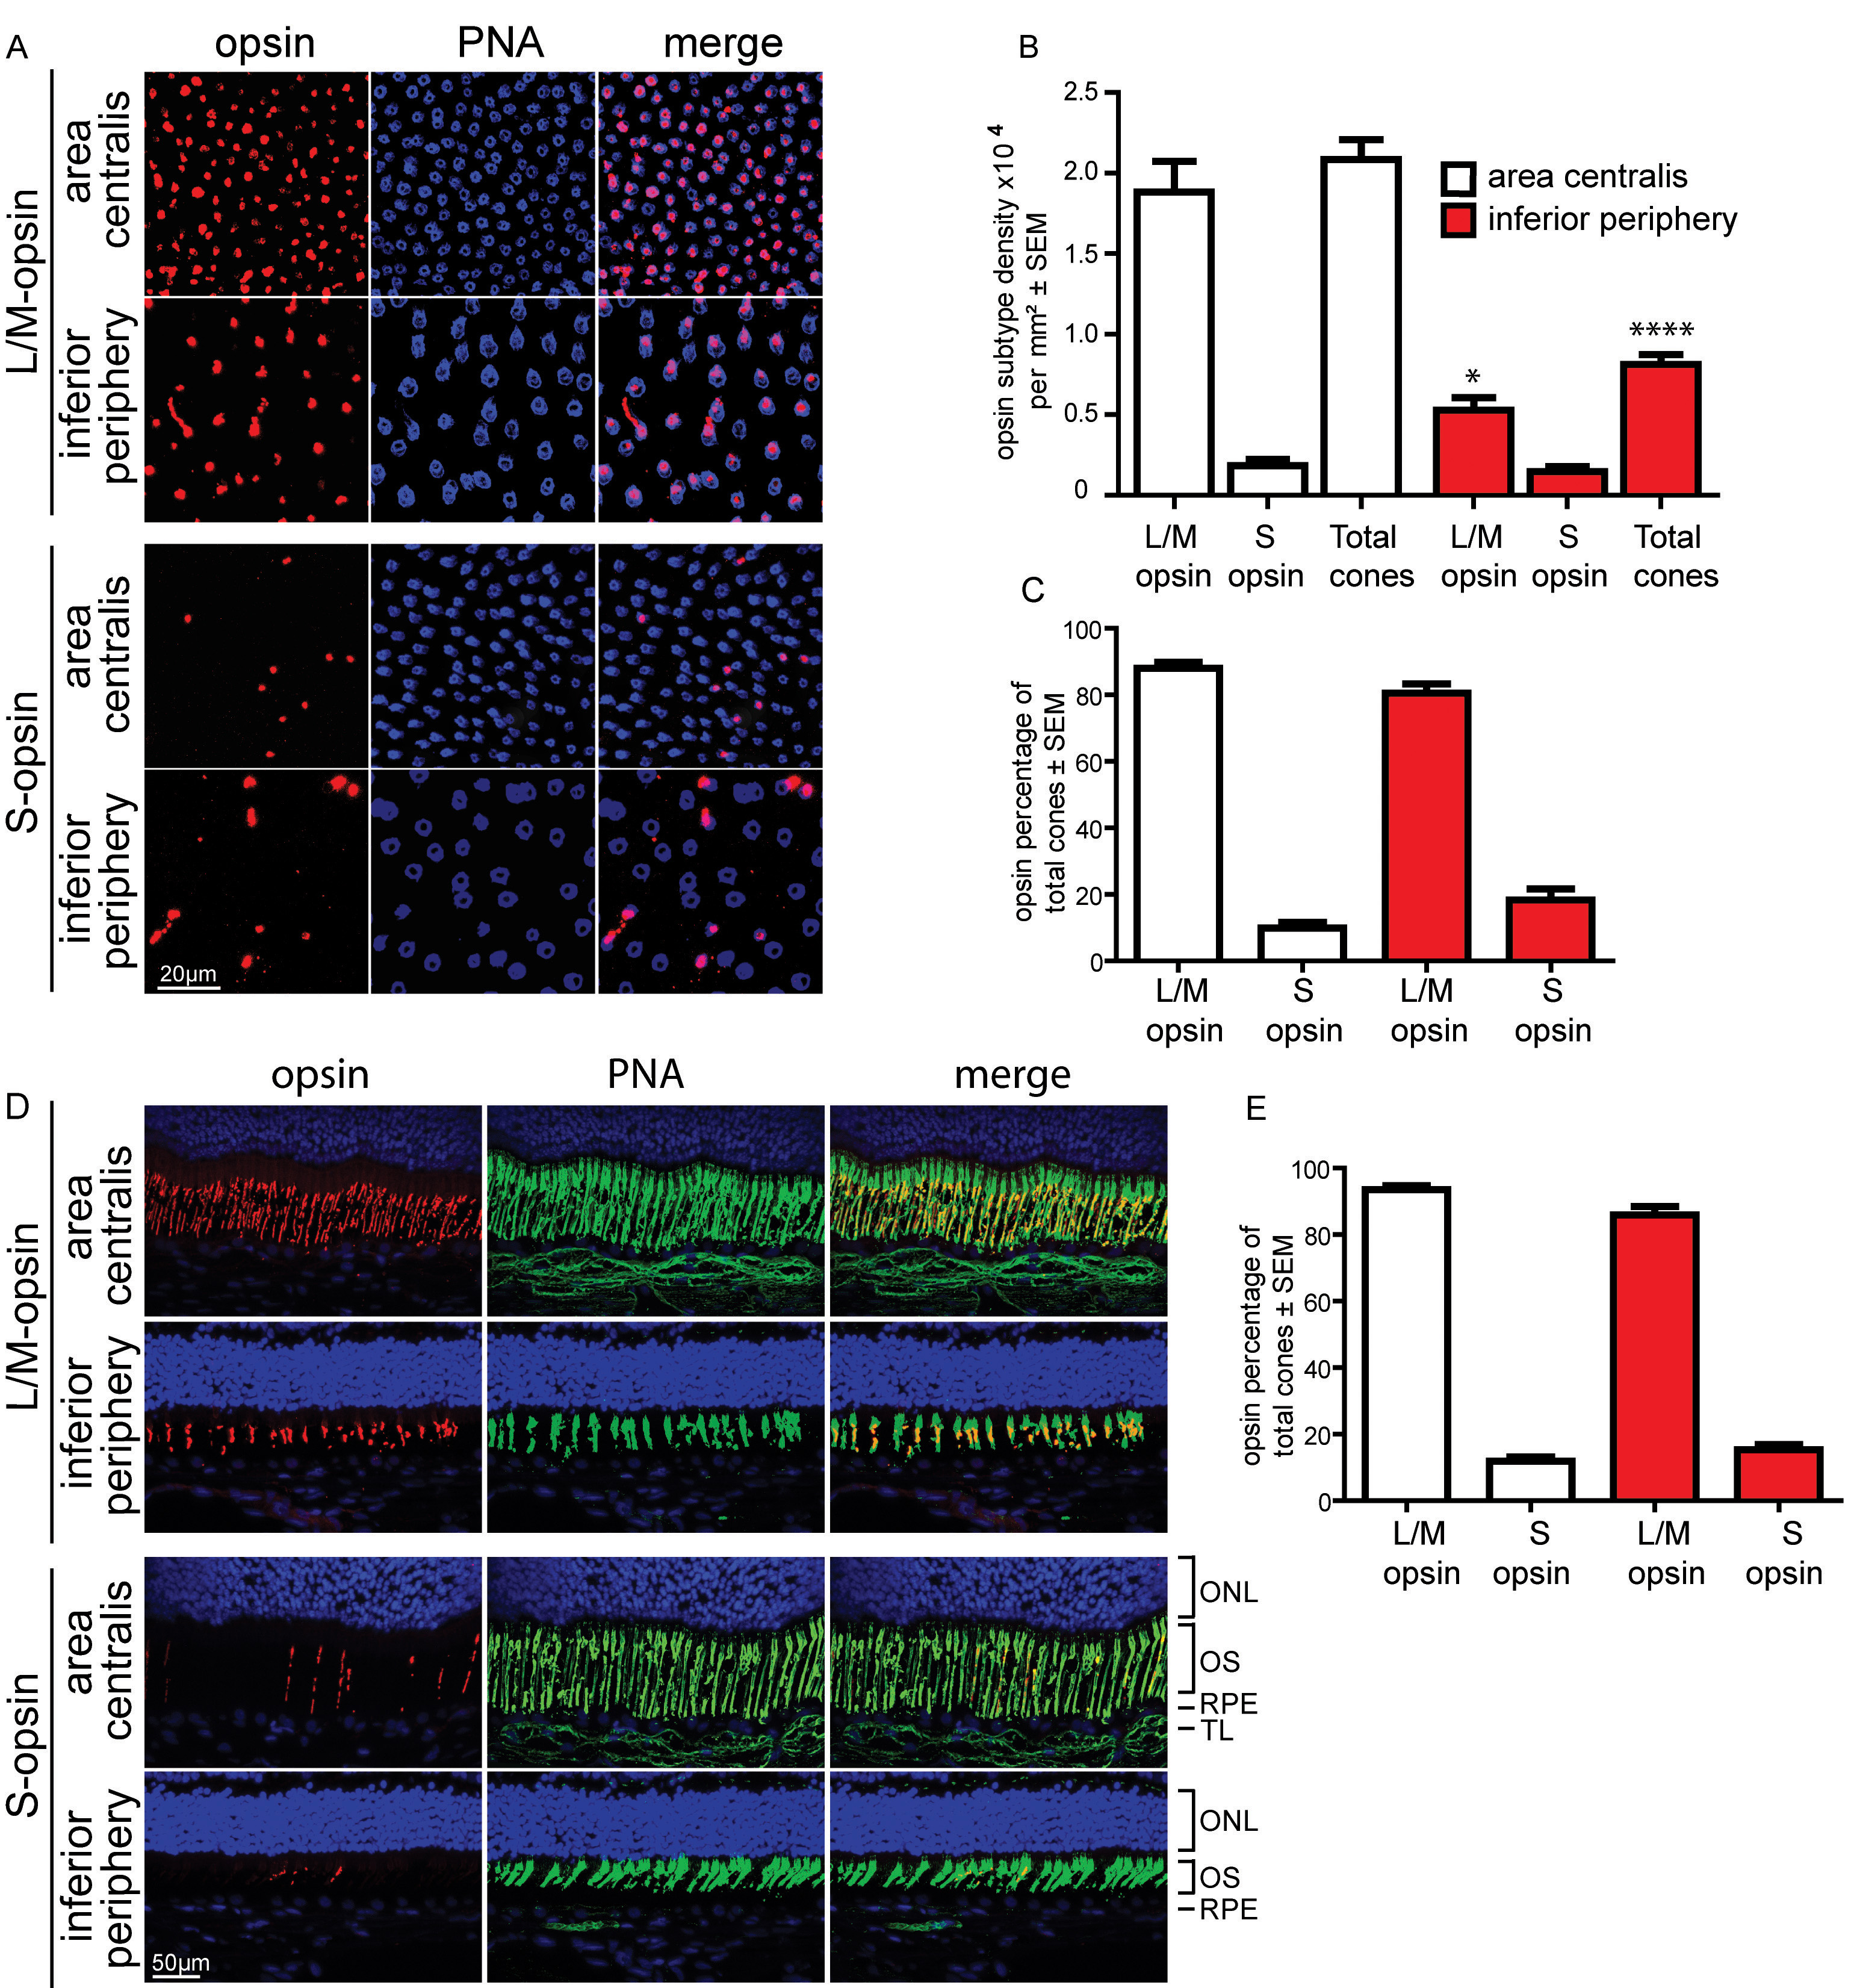
 Figure 2 of Mowat, Mol Vis 2008; 14:2518-2527.