Figure 1. Comparison between rod and cone
inner segment size, density, and ratio in the area centralis versus the
inferior periphery. Six eyes from 3 animals were examined. On retinal
flatmounts stained with peanut agglutinin (PNA; green) we identified a
clear visual streak superior to the optic nerve, with a temporal area
centralis. A representative retinal flatmount is shown in A
illustrating a clear visual streak superior to the optic nerve head
(ONH). Orientation is depicted: nasal (N), temporal (T), superior (S),
and inferior (I), and representative magnified images from the
highlighted areas of the retina are shown. The area centralis contained
a higher density of smaller rods and cones than the inferior periphery.
B shows representative differential interference contrast (DIC)
images of flatmounts from the area centralis and the inferior
periphery. PNA was used as a positive marker of the cone inner segment
(green). Six areas per retina were examined (3 area centralis, 3
inferior periphery) and average calculations for the rod and cone inner
segment cross sectional area and number were made. C shows that
the inner segment area of both cones and rods was significantly smaller
in the area centralis (cone: p=0.0028, rod: p=0.0034). The density of
both rods and cones was significantly higher in the area centralis than
in the periphery (D, cone: p<0.0001, rod: p<0.0005). Note
the difference in scale of each y-axis. E shows the ratio
between rods and cones in the areas of the retina; the ratio was
significantly lower in the area centralis (p<0.0001). Using an
unpaired t test, significant values are marked with asterisks
**** p<0.0001, *** p<0.001, ** p<0.01. In all graphs, the
inferior periphery bars are marked in red.
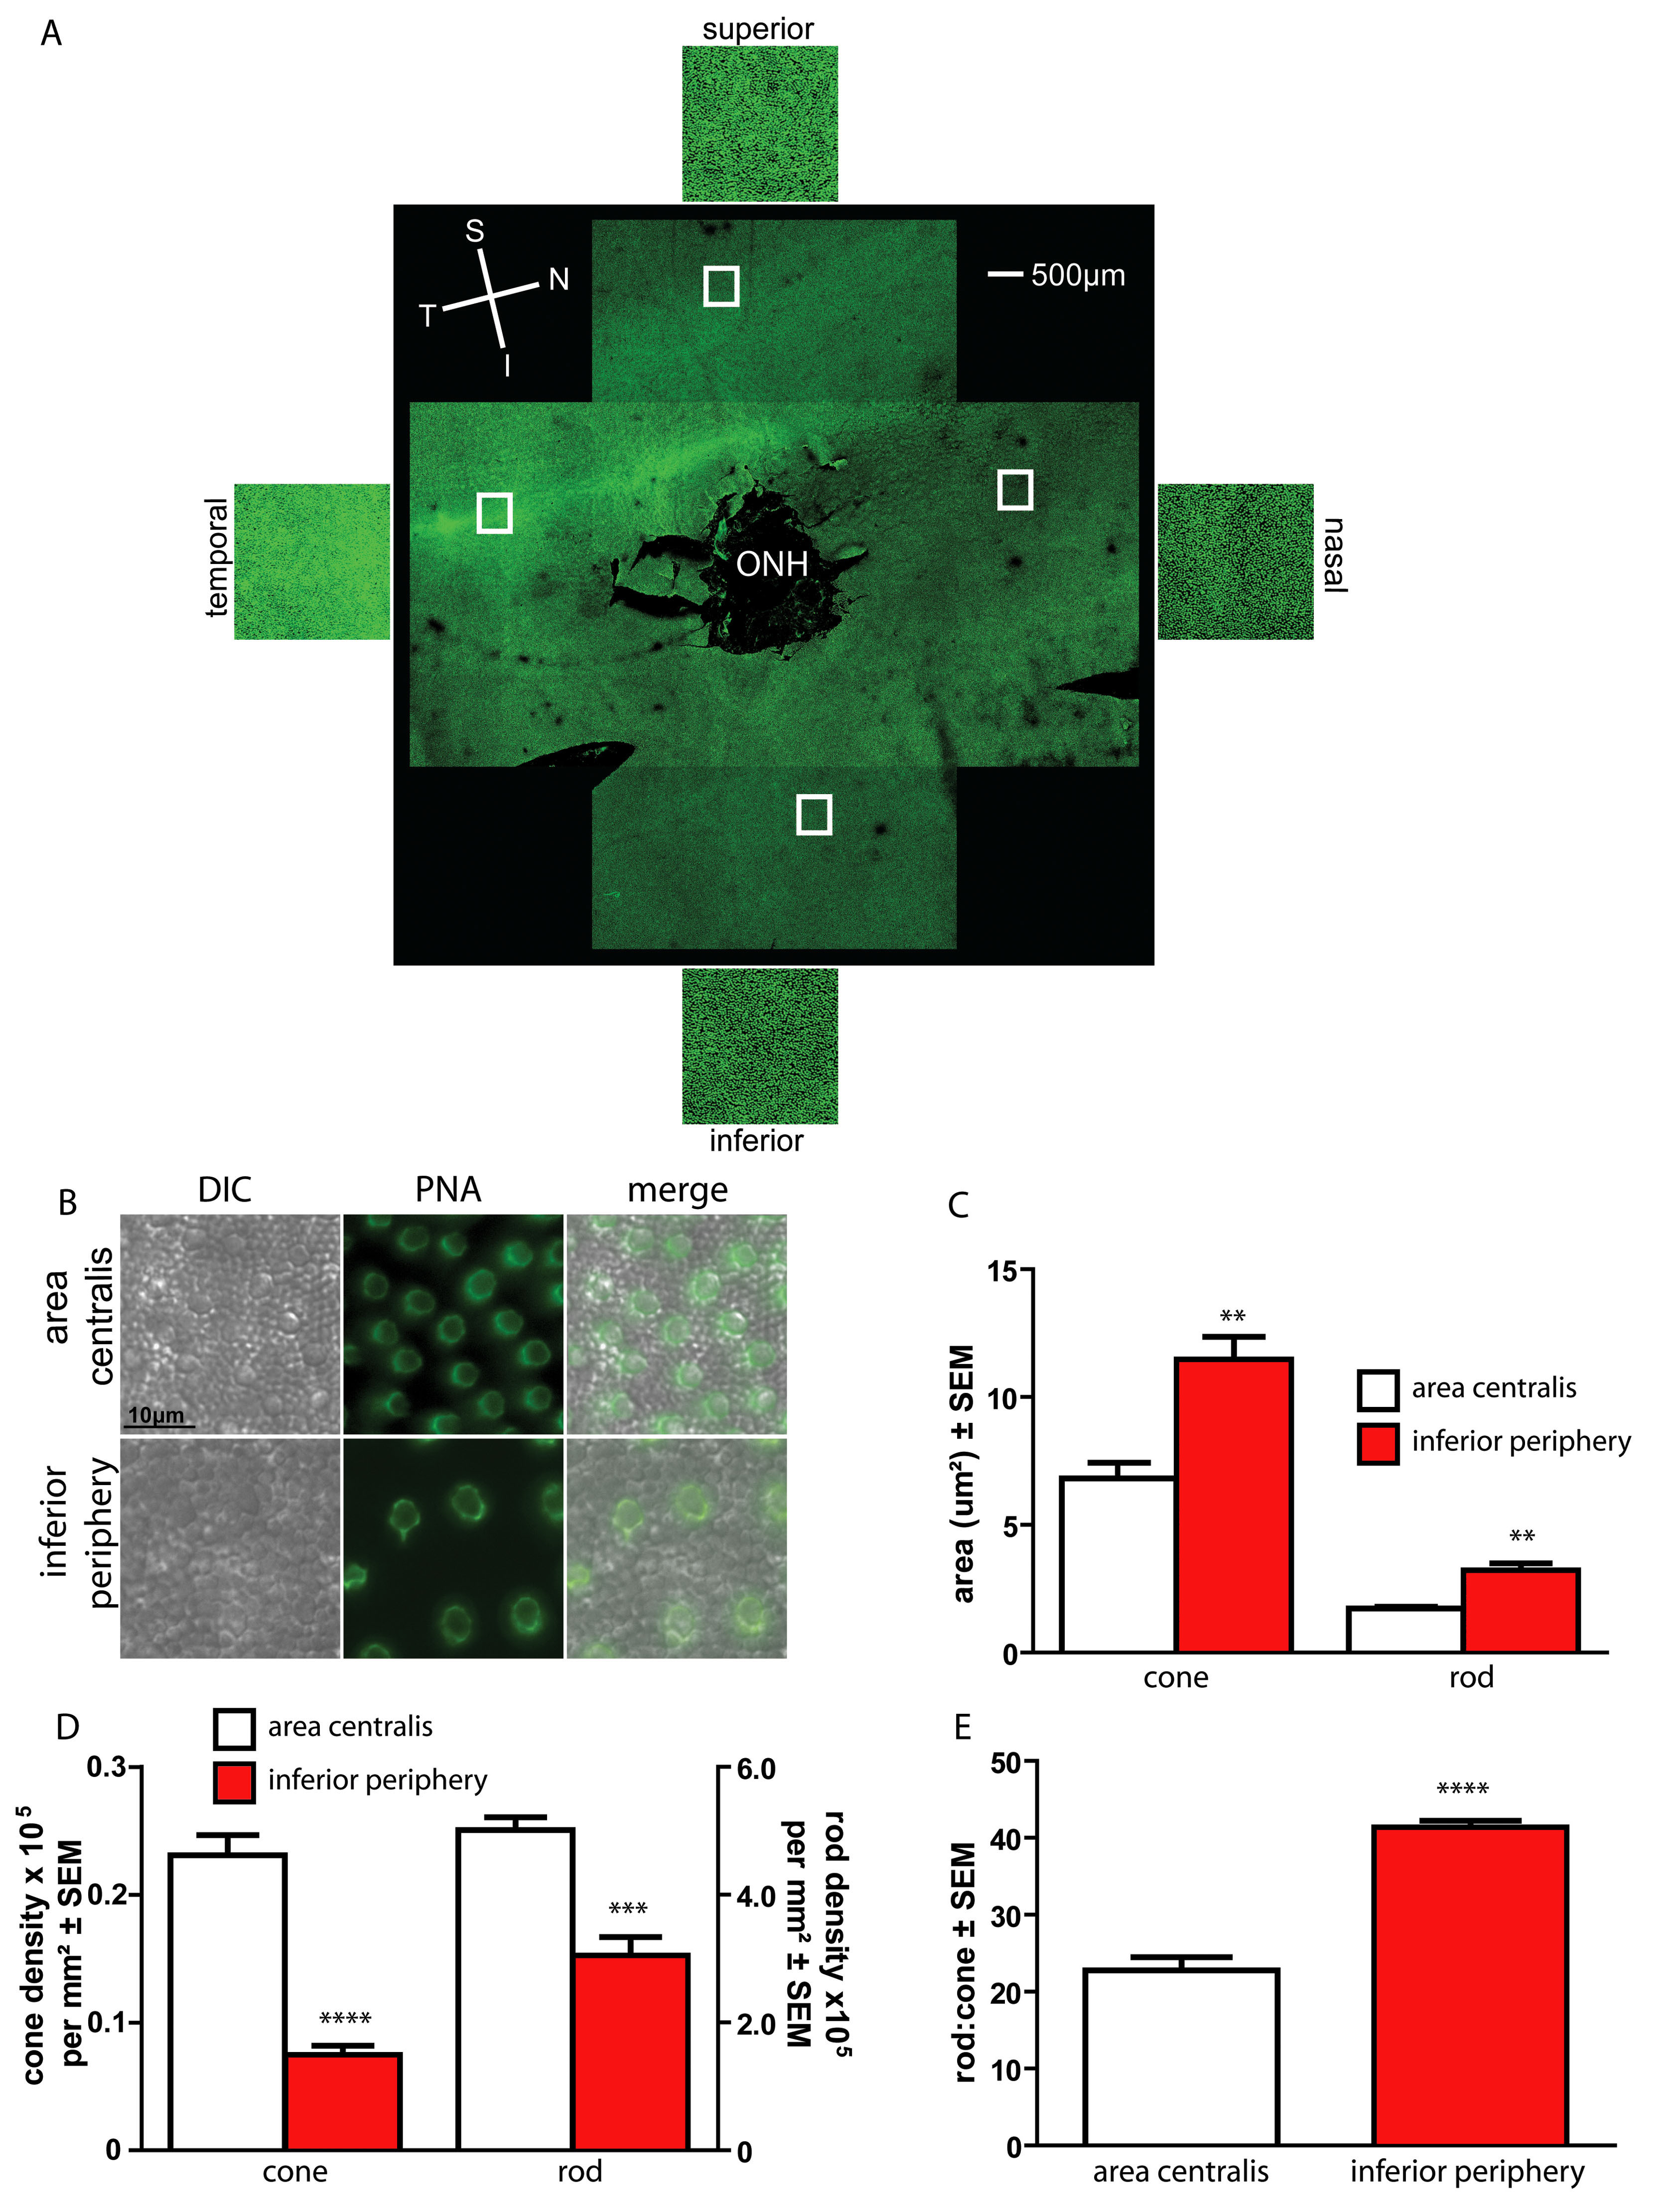
 Figure 1 of Mowat, Mol Vis 2008; 14:2518-2527.