Figure 8. A schematic representing the
four spots recovered from the two-dimensional gel profiles of the WT
αB-crystallin and individual deamidated mutant proteins. These are
numbered as spot number 1 to 4. For mass spectrometric analysis, the
individual protein spots were excised from a SDS-PAGE gel. After
destaining of the individual spots, the samples were washed for 10 min
with 25 mM ammonium bicarbonate before digestion with trypsin (12
ng/μl) for 16 h at 37 °C. Peptide solutions were then extracted using
100 μl of a 50:50 mixture of 5% formic acid and acetonitrile for 30
min. Supernatants were collected and evaporated to dryness. Samples
were resuspended in 10 μl of 0.1% formic acid and desalted using C-18
ZipTips. The samples were spotted to the MALDI-TOF 96 well gold-coated
target plates after mixing with cyano-4-hydroxycinnamic acid (CHCA)
matrix. MALDI-TOF MS was performed, and spectra were collected. The
identity of the proteins was determined by using the NCBI database.
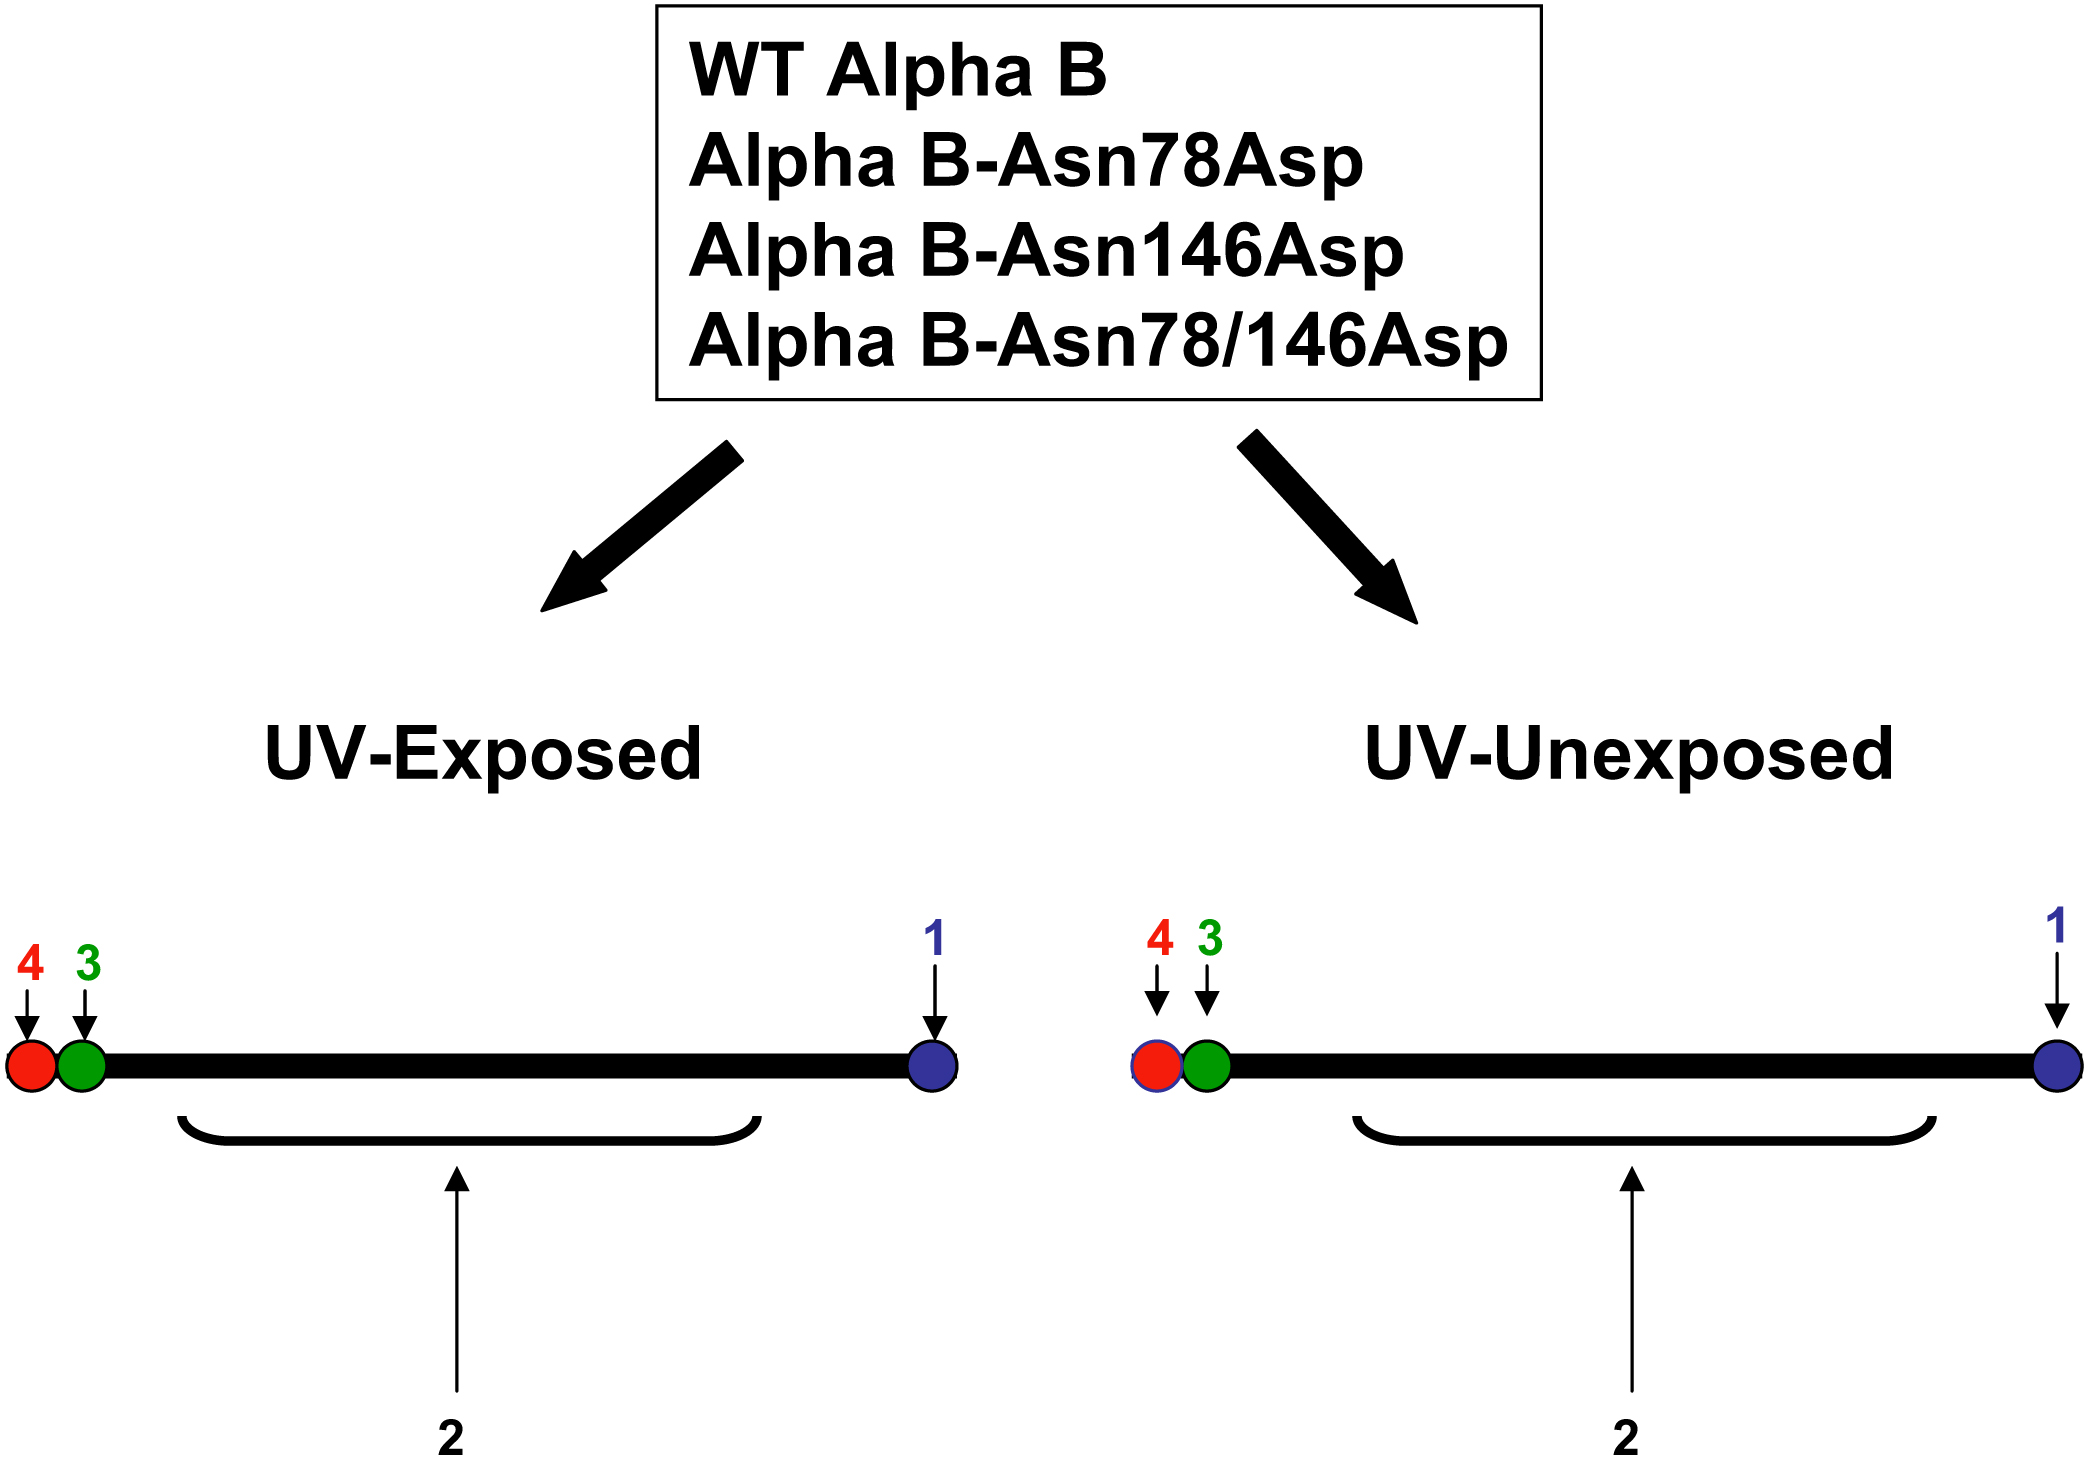
 Figure 8 of Mafia, Mol Vis 2008; 14:234-248.