Figure 1. Immunogold labeling of PDE in
ROS of rat retina. Light- or dark-adapted retinas were fixed and
embedded in LR White resin. Ultrathin sections of the retina were
incubated with PDEα antibody followed by donkey anti-rabbit secondary
antibody conjugated with 12 nm gold particles. Electron micrographs
were captured from dark-adapted (A) or light-adapted (B)
retina. The scale bar represents 300 nm. The arrow indicates rim
positioned phosphodiesterase (PDE). C: PDE distribution in
light- or dark-adapted rod outer segment (ROS) disc membranes were
quantified. Dark-adapted and light-adapted retinas were fixed and
processed for immunogold labeling with PDEα antibody. The distances of
each gold particle to the nearest ROS plasma membrane were measured,
and the cumulative distribution profiles were plotted. Open squares
represent the average distribution of PDE in light-adapted ROS, and
filled squares represent PDE distribution in dark-adapted ROS. Error
bars represented the standard error of the mean from four different
experiments. Filled small circles with a dotted line represent a
simulated random distribution of PDE. The observed distribution of PDE
near ROS center in both light and dark-adapted conditions is lower than
the given random distribution because the probability of obtaining
sections that intersects the longitudinal axis of ROS is low.
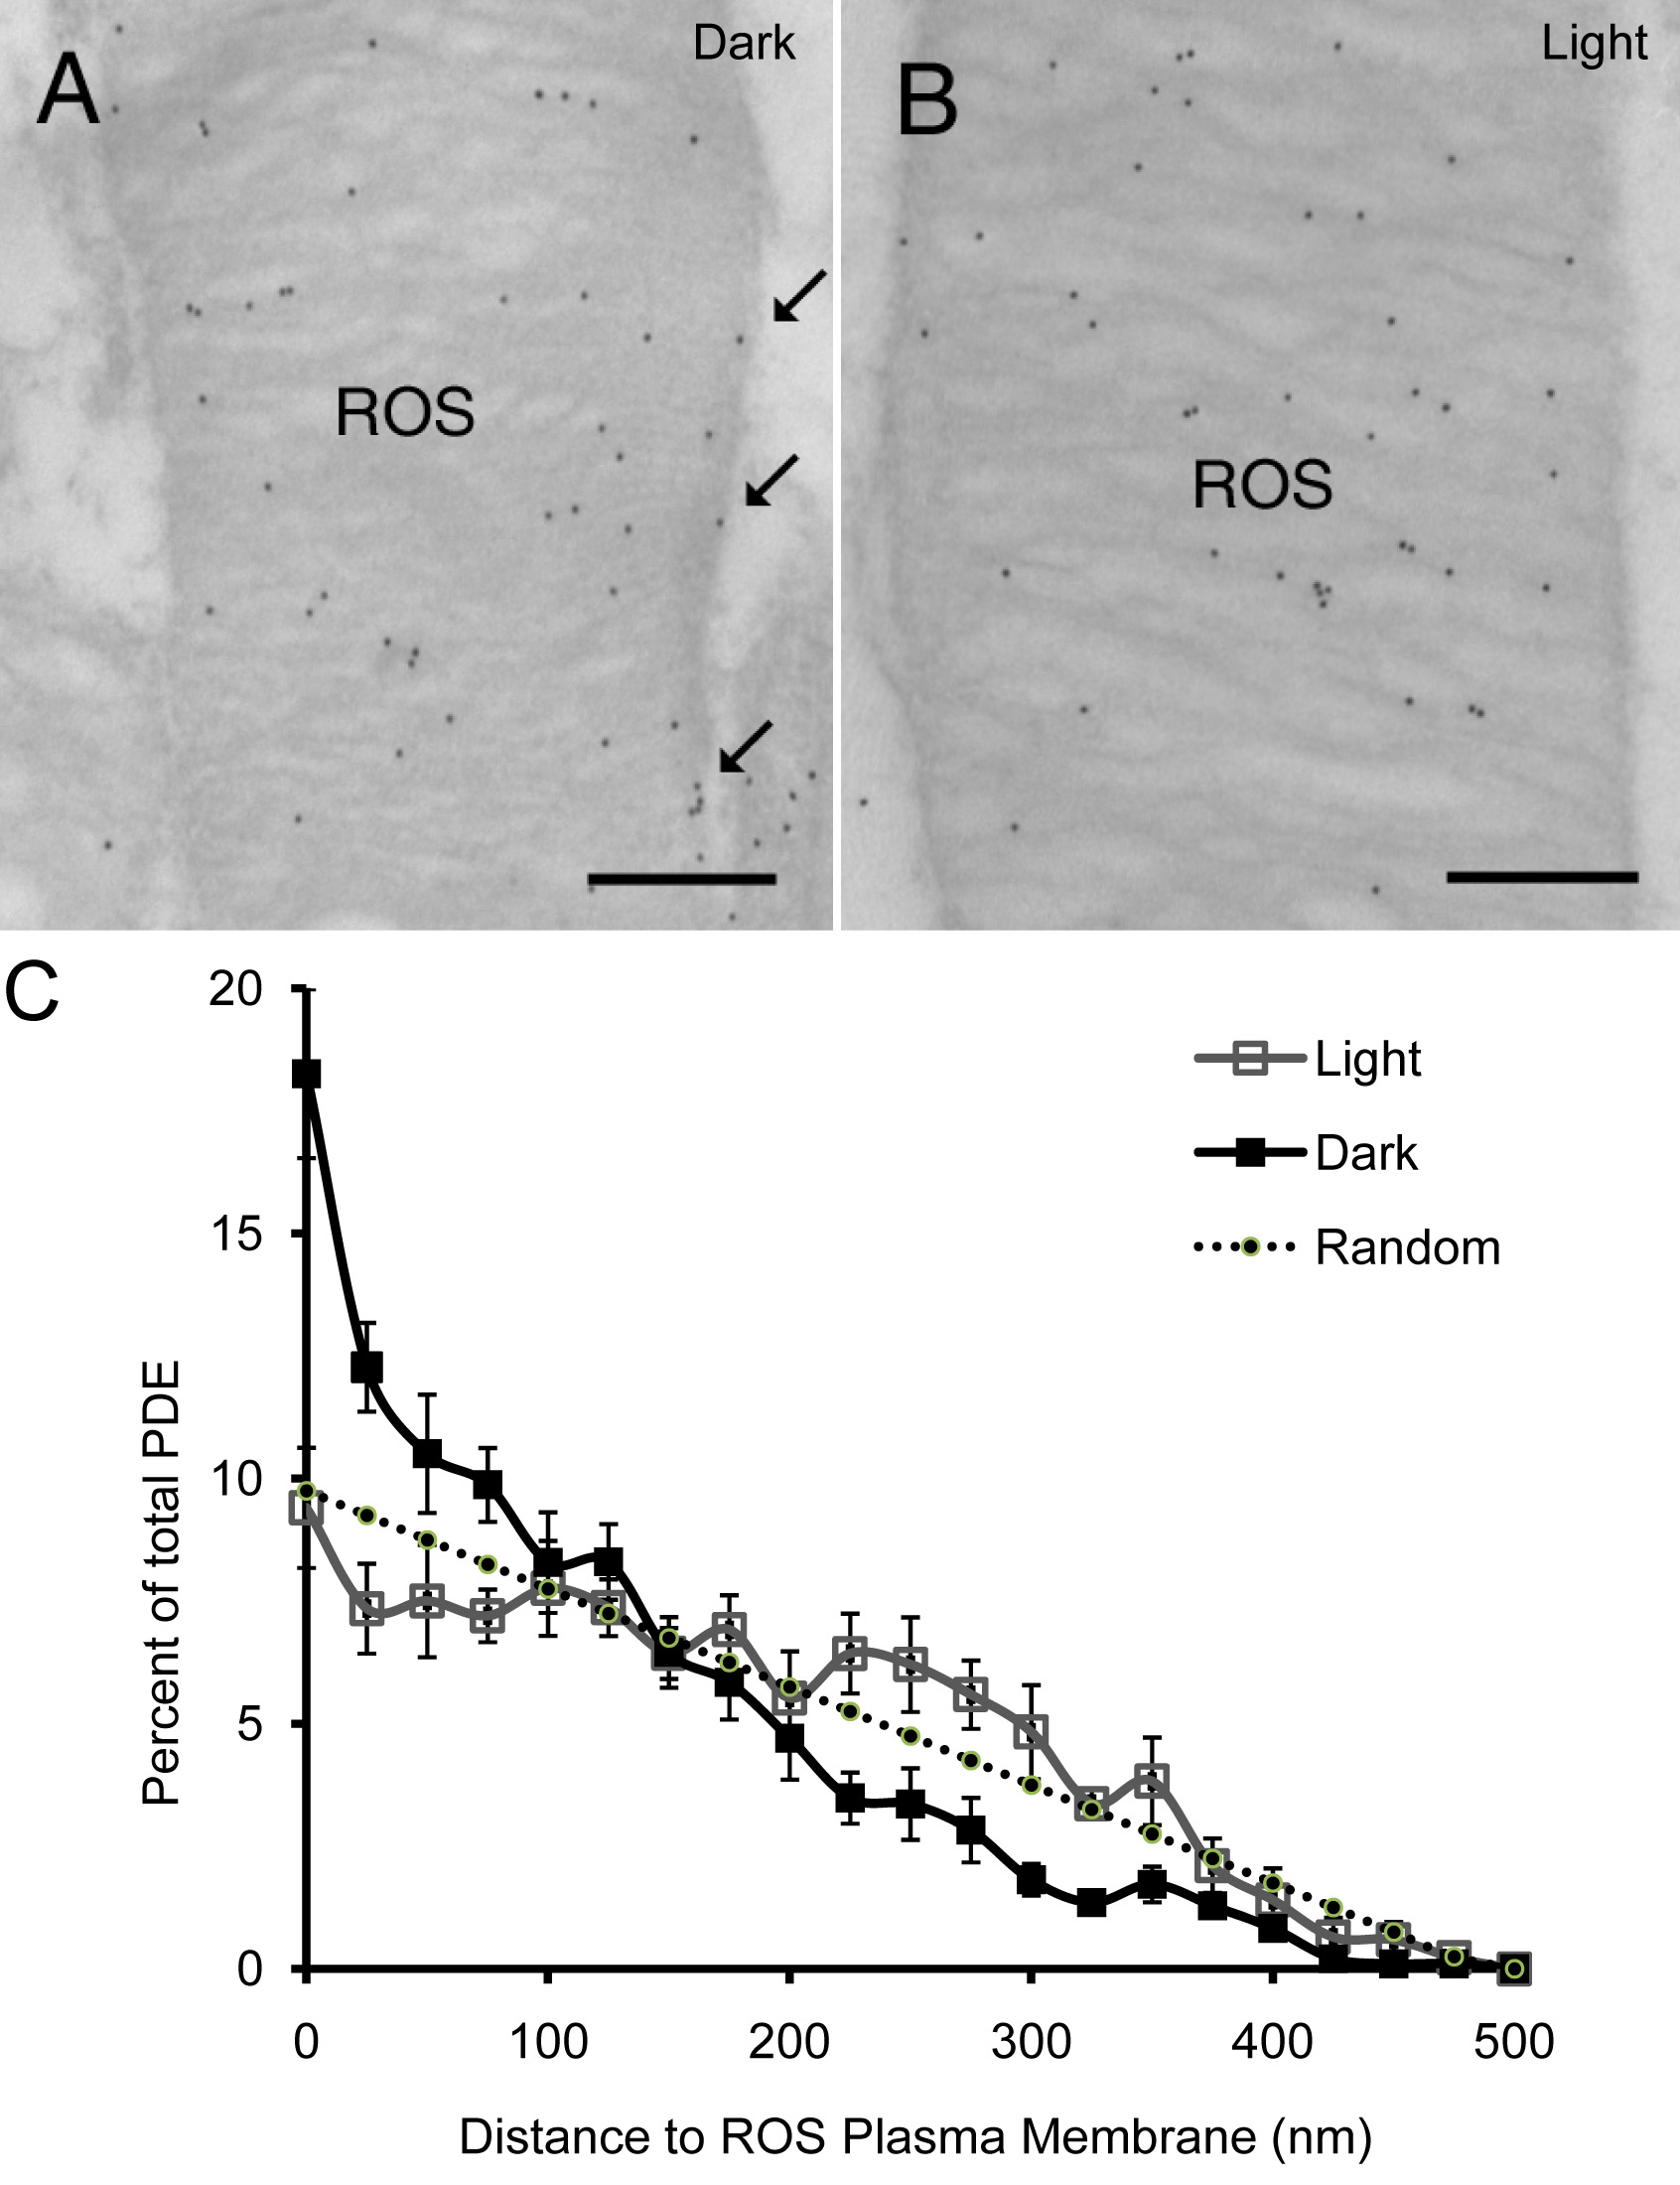
 Figure 1 of Chen, Mol Vis 2008; 14:2509-2517.