Figure 5 of
Akula, Mol Vis 2008; 14:2499-2508.
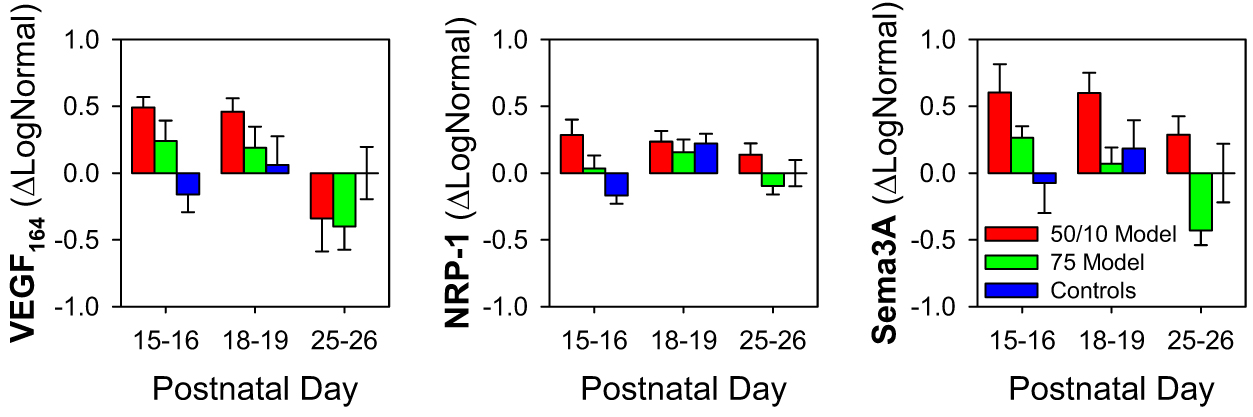
Figure 5.
Mean±SEM ΔLogNormal (Equation 5) mRNA expression. Growth factor expression data for the 50/10 model, 75 model, and control rats at P15–16, P18–19, and P25–26 are shown. Note that mean ΔLogNormal for P25–26 control rats is zero.
 Figure 5 of Akula, Mol Vis 2008; 14:2499-2508.