Figure 3. Mean±SEM ΔLogNormal (Equation
5) ERG and blood vessel parameters for 50/10 model, 75 model, and
control rats at P15–P16, P18–P19, and P25–P26. Note that mean
ΔLogNormal for P25–P26 control rats is zero. A: Sensitivity of
the rod photoreceptors, Srod, and postreceptor
neural retina, Sm. B: Arteriolar tortuosity, TA.
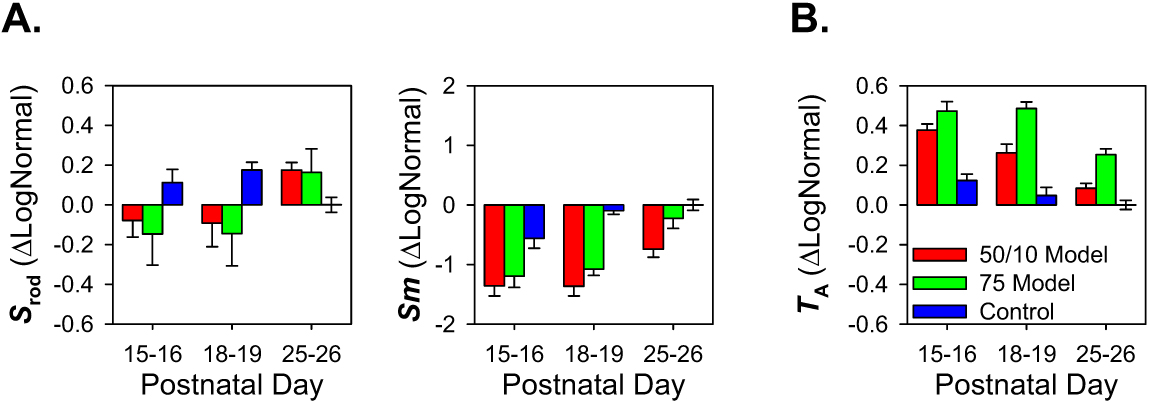
 Figure 3 of Akula, Mol Vis 2008; 14:2499-2508.