Figure 2. Composite RetCam images (top
panels) and the retinal arterioles as segmented by RISA (bottom
panels). The images were obtained from a 50/10 model, a 75 model, and a
control rat at P25–26. The posterior pole, defined as the region
bounded by the vortex veins and concentric to the optic nerve head, is
indicated (circles). The integrated curvatures (radians∙pixel−1)
corresponding to each segmented vessel are given. The mean tortuosity
of the arterioles, TA (radians∙pixel−1),
for each eye is given at the bottom of the figure.
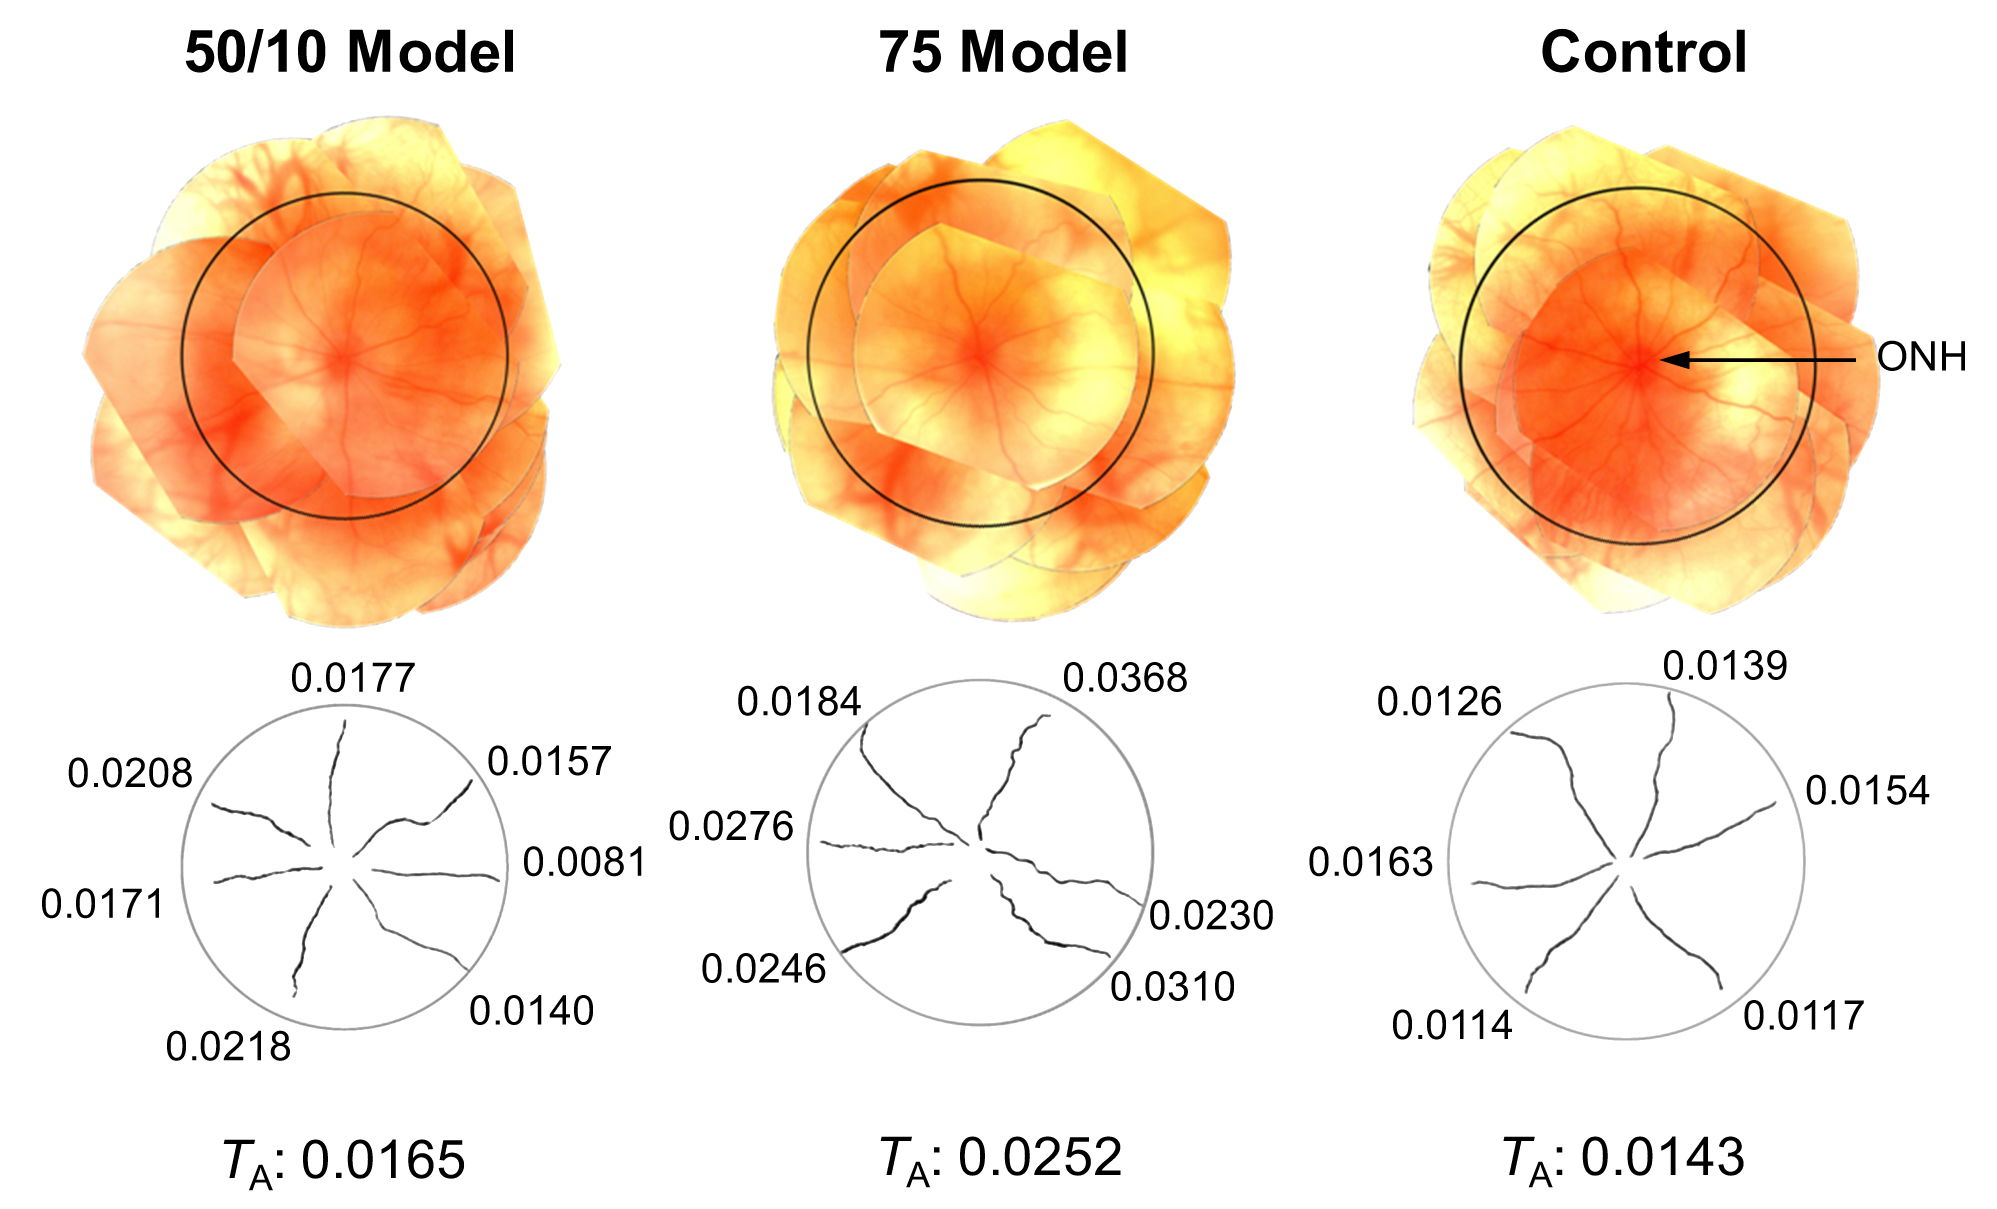
 Figure 2 of Akula, Mol Vis 2008; 14:2499-2508.