Figure 1. Electroretinographic (ERG)
analyses of
rod photoreceptor and postreceptor neural function. A: Sample
ERG responses from a P25–P26 control rat
elicited with green LED (left) and “white” xenon arc (right) full field
stimuli. The number of rhodopsin photoisomerizations per rod (R*)
produced by each flash is indicated at the end of each trace. Traces
are numbered for reference in panels B and C. B:
Determination of rod photoreceptor function. Sensitivity of the rods, Srod,
is determined by fit of Equation 3 (red dashes) to the leading
edge of ERG a-waves (circles) elicited with bright flashes. For this
subject, Srod was 3.79 R*−1∙s−2.
C: Determination of postreceptor function. The b-waves elicited
by dim flashes (left panel) were scaled by the intensity of the flash
used to elicit them (middle panel) and the Michaelis–Menten equation
with the exponent set to −1 (Equation 4) fit to the resulting
scaled response amplitudes (right panel). The limit of the function as
intensity approaches zero, Sm, defines postreceptor
sensitivity. For this subject, Sm was 224 µV∙R*−1.
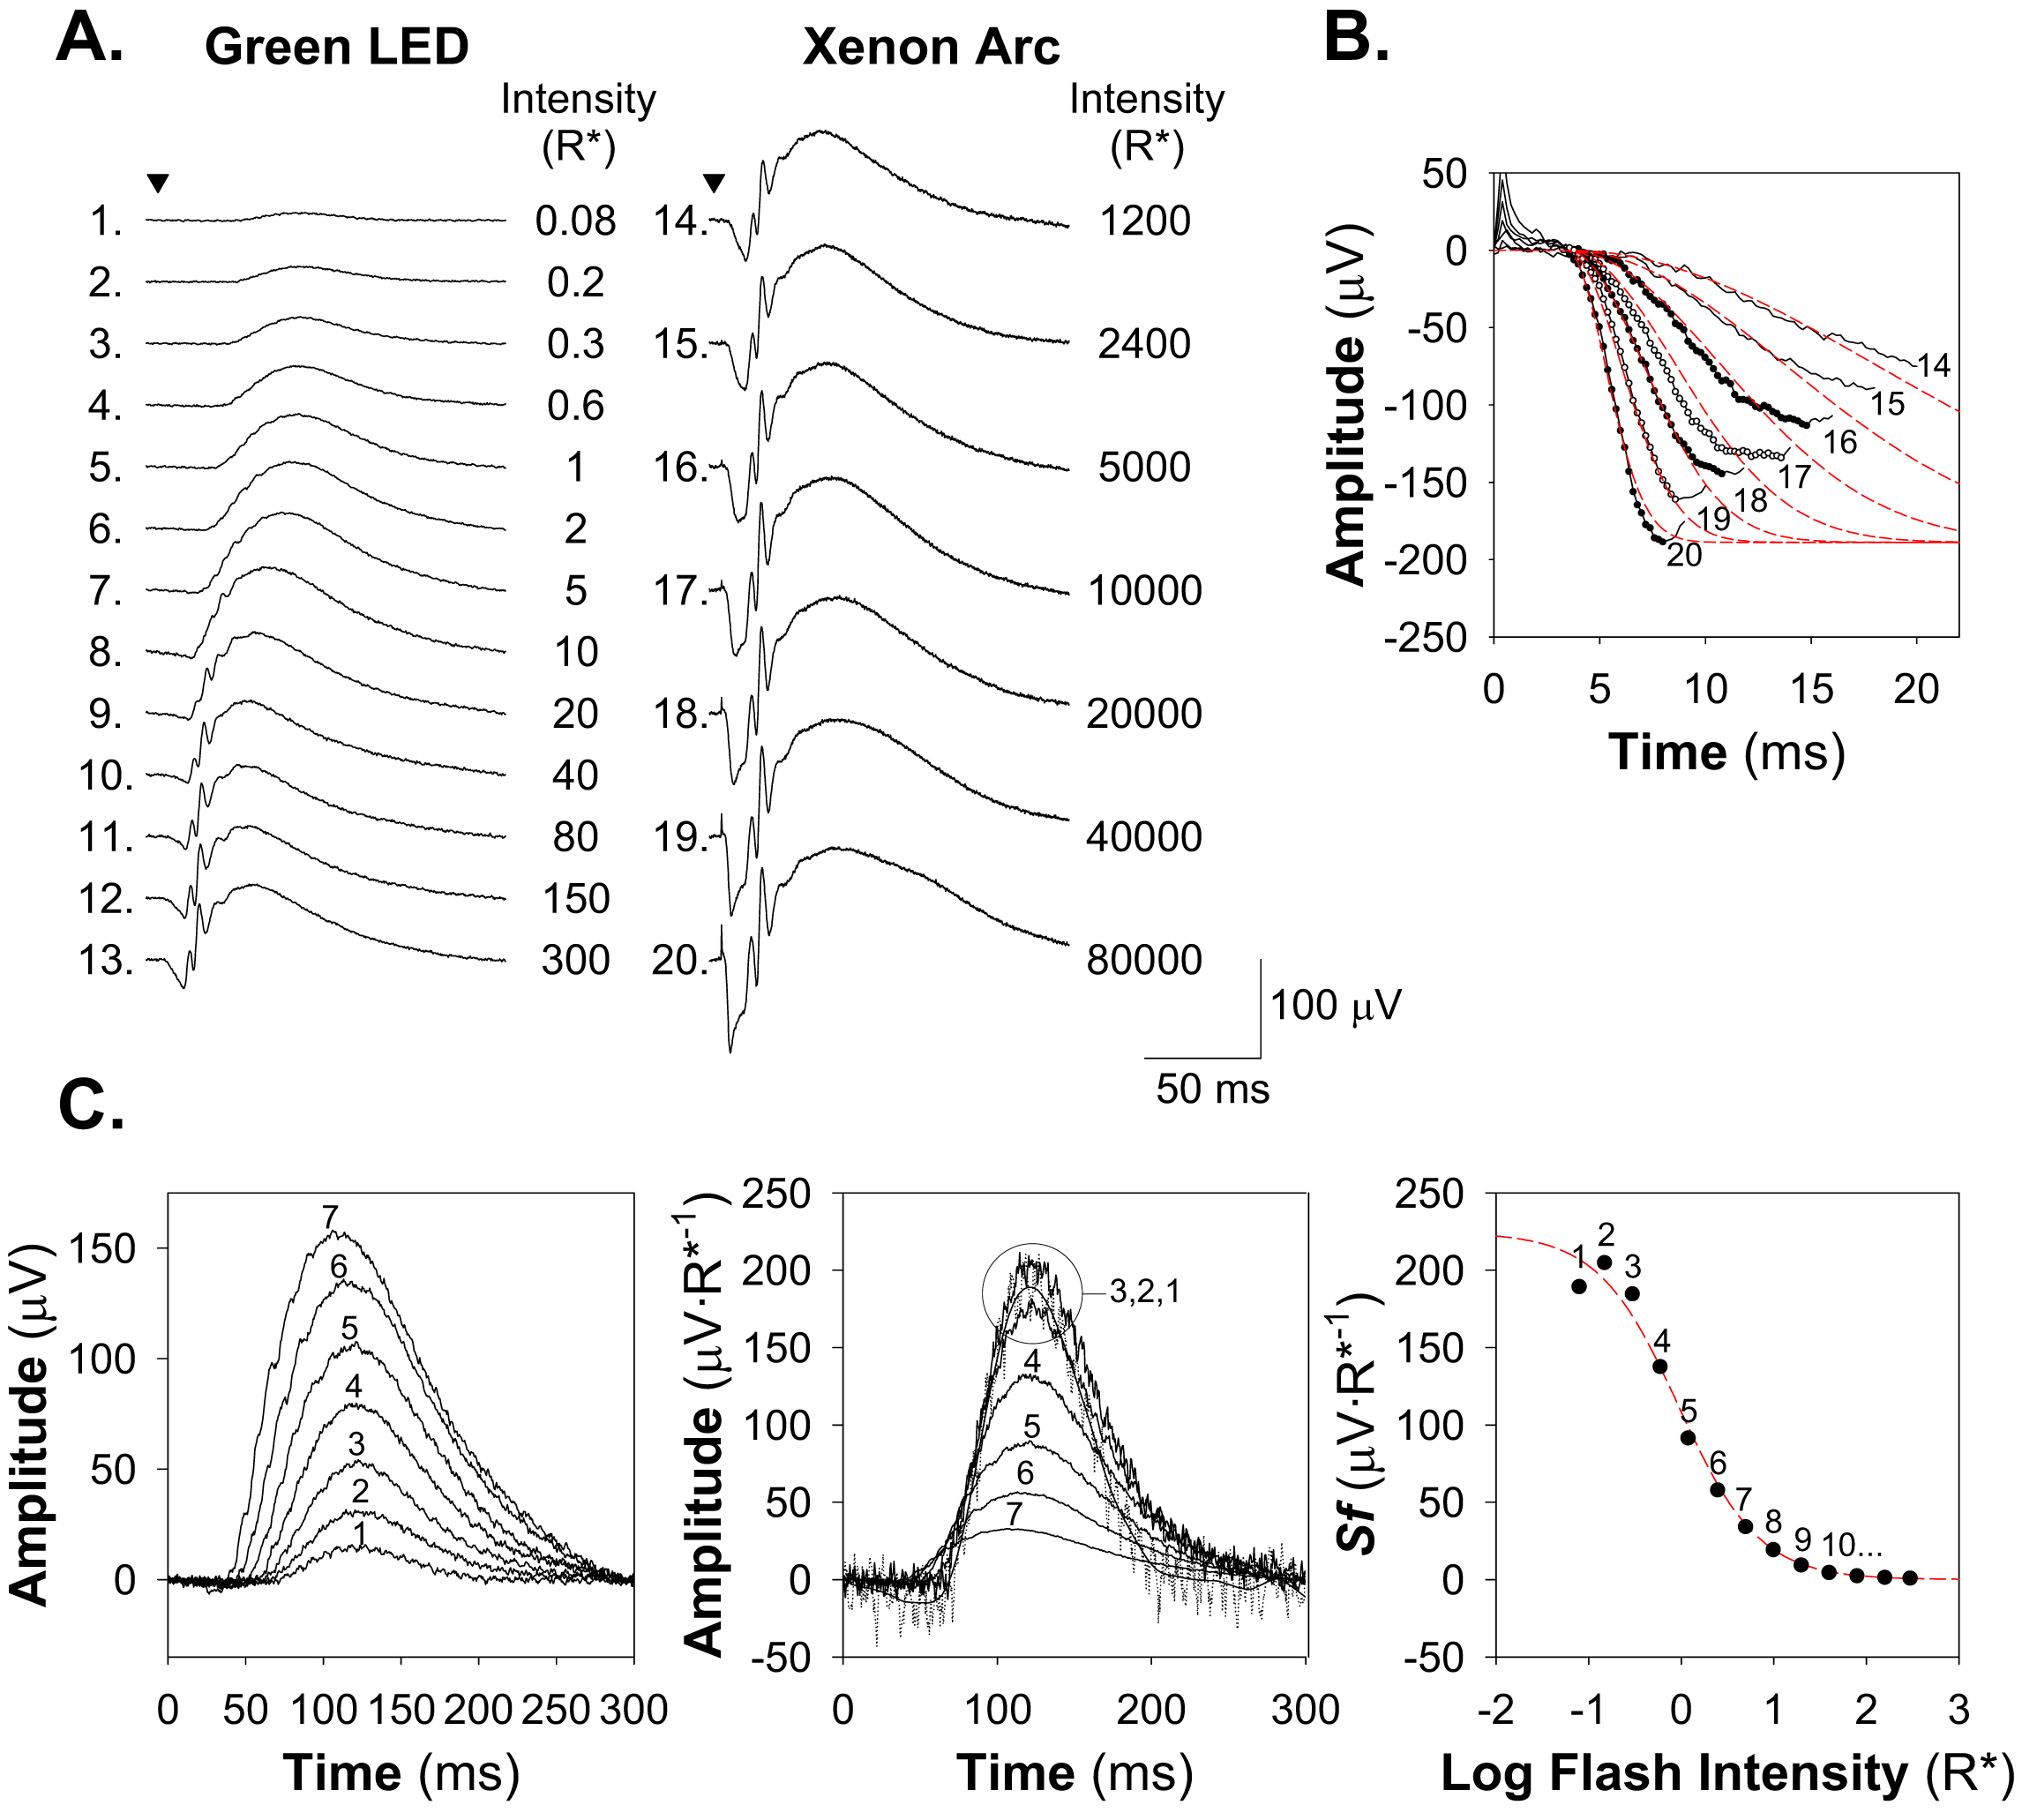
 Figure 1 of Akula, Mol Vis 2008; 14:2499-2508.