Figure 5. Quantification of fluorescence
intensity among GFP-labeled cells. A: Representative
GFP-immunostained cells shown in A were analyzed in MetaMorph (B).
The scale bar represents 10 μm for A and B. Bright
cells were color coded as blue (cells 1, 2, 3 and 4), and dim cells
were yellow (cells 11, 12, and 14). C: Quantification of
fluorescence intensity of bright and dim cells were analyzed in four
individual retinas. For each retina, 10 bright cells and 10 dim cells
were chosen using the same threshold. Value represents mean±SD (n=10
for each cell subpopulation). Triple asterisks (***) indicate
p<0.001. D displays the ratio of bright cell fluorescence to
dim cell fluorescence intensity. For all four retinas, bright cells
were 2.0±0.3 (mean±SD) fold brighter than dim cells in fluorescence
intensity.
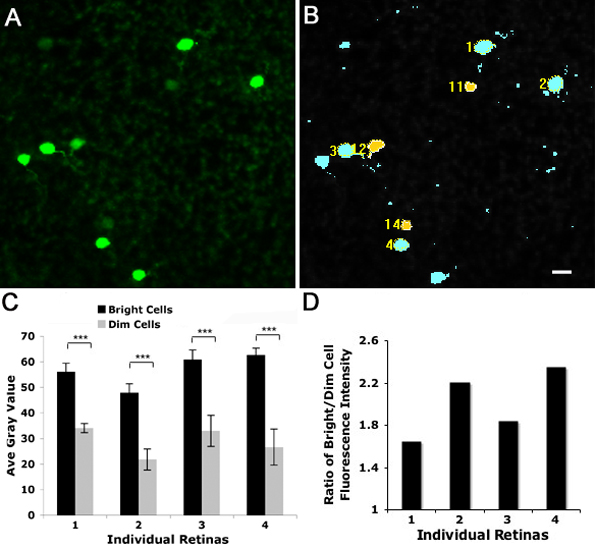
 Figure 5 of Meng, Mol Vis 2008; 14:2475-2483.